CPD Approach Algo Line [ValiantTrader]CPD Approach Algo Line Indicator - Explanation
This indicator, developed by ValiantTrader, is a sophisticated tool for analyzing price action and volume distribution across different timeframes. Here's how it works and how traders can use it:
Core Functionality
The indicator performs a "Candle Price Distribution" (CPD) analysis by:
Collecting data from a higher timeframe (configurable via input)
Dividing the price range into horizontal zones (either by tick size or evenly distributed)
Analyzing price behavior within each zone
Key Features and Trading Applications
1. Price Zone Analysis
Divides the price range into customizable zones (default 24 zones)
Shows how many candles have traded in each zone
Displays what percentage of total candles occurred in each zone
Trading Use: Identifies high-probability support/resistance areas where price has historically spent more time.
2. Delta Calculation
Shows the difference in candle counts between adjacent zones
Color-coded (green for positive, red for negative)
Trading Use: Helps spot areas where price behavior changes significantly (potential reversal zones).
3. Volume Clusters
Aggregates volume traded within each price zone
Visualized as colored backgrounds
Trading Use: Identifies high-volume nodes which often act as strong support/resistance.
4. Pressure Zones
Scores each zone based on where candles closed within the zone
Positive pressure (green) when candles closed in upper part
Negative pressure (red) when candles closed in lower part
Trading Use: Shows where buyers or sellers were more dominant at each price level.
5. Advanced Candle Pattern Detection
Tracks wick engulfing patterns
Measures body engulfing patterns
Counts rejection candles (long wicks)
Identifies dominant candles (large bodies)
Trading Use: Provides additional confirmation of potential reversal or continuation patterns.
6. Draggable Reference Line
Allows traders to place a horizontal line at any price level
Automatically shows statistics for the zone containing the line
Trading Use: Quickly analyze any price level's historical significance.
Practical Trading Applications
Support/Resistance Identification: The zones with highest candle counts typically represent strong support/resistance levels.
Breakout Trading: When price moves into zones with few previous candles, it may indicate breakout potential.
Reversal Trading: Zones where delta changes significantly (from positive to negative or vice versa) can signal potential reversals.
Volume-Weighted Analysis: Combining candle counts with volume clusters helps identify the most significant price levels.
Multi-Timeframe Analysis: By setting the custom timeframe to a higher period, traders can see where institutional levels exist on weekly/daily charts while trading on lower timeframes.
The indicator is particularly useful for traders who employ volume profile, market profile, or order flow concepts in their trading strategy. The visual presentation makes it easy to quickly assess the most significant price levels on any chart.
Cerca negli script per "volume profile"

Linear Regression Channel UltimateKey Features and Benefits
Logarithmic scale option for improved analysis of long-term trends and volatile markets
Activity-based profiling using either touch count or volume data
Customizable channel width and number of profile fills
Adjustable number of most active levels displayed
Highly configurable visual settings for optimal chart readability
Why Logarithmic Scale Matters
The logarithmic scale option is a game-changer for analyzing assets with exponential growth or high volatility. Unlike linear scales, log scales represent percentage changes consistently across the price range. This allows for:
Better visualization of long-term trends
More accurate comparison of price movements across different price levels
Improved analysis of volatile assets or markets experiencing rapid growth
How It Works
The indicator calculates a linear regression line based on the specified period
Upper and lower channel lines are drawn at a customizable distance from the regression line
The space between the channel lines is divided into a user-defined number of levels
For each level, the indicator tracks either:
- The number of times price touches the level (touch count method)
- The total volume traded when price is at the level (volume method)
The most active levels are highlighted based on this activity data
Understanding Touch Count vs Volume
Touch count method: Useful for identifying key support/resistance levels based on price action alone
Volume method: Provides insight into levels where the most trading activity occurs, potentially indicating stronger support/resistance
Practical Applications
Trend identification and strength assessment
Support and resistance level discovery
Entry and exit point optimization
Volume profile analysis for improved market structure understanding
This Linear Regression Channel indicator combines powerful statistical analysis with flexible visualization options, making it an invaluable tool for traders and analysts across various timeframes and markets. Its unique features, especially the logarithmic scale and activity profiling, provide deeper insights into market behavior and potential turning points.

Volume Heatmap 2024 | NXT2017 Christmas EditionHi big players around the world,
I wish you a merry christmas time.
Today I have a nice present for you: a new volume heatmap indicator for free using!
HISTORY
My first volume heatmap project got a lot of feedback and a big demand. You can find it here:
In this time pinescript version 4 was the newest one and I worked the first time with arrays.
Today we have pinescript version 5 and some new features. This is why I tried again with matrix function and the results are better than I expected.
HOW IT WORKS
The indicator calculates similar like the volume profile. It looks back and every volume where the close price is on the same row area, the volume will cumulated. How much rows the new chart view is showing, you can choose manually.
The mind behind this is to find high volume levels, where high volume catch the price in a range or get function as support/resistance line.
PICTURES
I hope it helps for your trading. You are welcome to give some comments.
Merry christmas and best regards
NXT2017

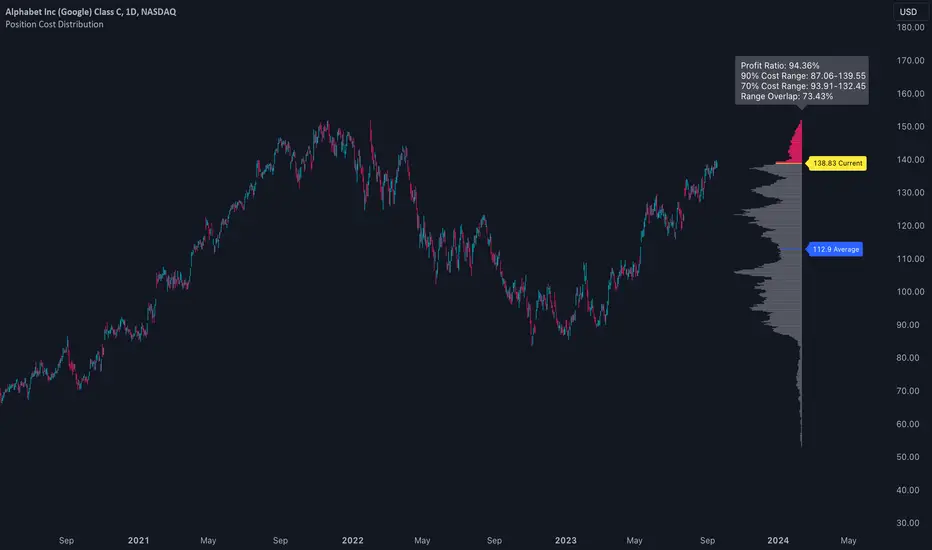
Position Cost DistributionThe Position Cost Distribution indicator (also known as the Market Position Overview, Chip Distribution, or CYQ Algorithm) provides an estimate of how shares are distributed across different price levels. Visually, it resembles the Volume Profile indicator, though they rely on distinct computational approaches.
🟠 Principle
The Position Cost Distribution algorithm is based on the principle that a security's total shares outstanding usually remains constant, except under conditions like stock splits, reverse splits, or new share issuance. It views all trading activity as simply exchanging share positions between holders at different price points.
By analyzing daily trade volume and the prior day's distribution, the algorithm infers the resulting share distribution after each day. By tracking these inferred transpositions over time, the indicator builds up an aggregate view of the estimated share concentration at each price level. This provides insights into potential buying and selling pressure zones that could form support or resistance areas.
Together with the Volume Profile, the Position Cost Distribution gives traders multiple lenses for examining market structure from both a volume and positional standpoint. Both can help identify meaningful technical price levels.
🟠 Algorithm
The algorithm initializes by allocating all shares to the price range encompassed by the first bar displayed on the chart. Preferably, the chart window should include the stock's IPO date, allowing the model to distribute shares specifically to the IPO price.
For subsequent trading sessions, the indicator performs the following calculations:
1. The daily turnover ratio is calculated by dividing the bar's trading volume by total outstanding shares.
2. For each price level (bucket), the number of shares is reduced by the turnover amount to represent shares transferring from existing holders.
3. The bar's total volume is then added to buckets corresponding to that period's price range.
Currently, the model assumes each share has an equal probability of being exchanged, regardless of how long ago it was acquired or at what price. Potential optimizations could incorporate factors like making shares held longer face a smaller chance of transfer compared to more recently purchased shares.
────────────────────────────────────────────
中文介绍:该指标为“筹码分布”的一个 TradingView 实现 :)
Multi-Asset Performance [Spaghetti] - By LeviathanThis indicator visualizes the cumulative percentage changes or returns of 30 symbols over a given period and offers a unique set of tools and data analytics for deeper insight into the performance of different assets.
Multi Asset Performance indicator (also called “Spaghetti”) makes it easy to monitor the changes in Price, Open Interest, and On Balance Volume across multiple assets simultaneously, distinguish assets that are overperforming or underperforming, observe the relative strength of different assets or currencies, use it as a tool for identifying mean reversion opportunities and even for constructing pairs trading strategies, detect "risk-on" or "risk-off" periods, evaluate statistical relationships between assets through metrics like correlation and beta, construct hedging strategies, trade rotations and much more.
Start by selecting a time period (e.g., 1 DAY) to set the interval for when data is reset. This will provide insight into how price, open interest, and on-balance volume change over your chosen period. In the settings, asset selection is fully customizable, allowing you to create three groups of up to 30 tickers each. These tickers can be displayed in a variety of styles and colors. Additional script settings offer a range of options, including smoothing values with a Simple Moving Average (SMA), highlighting the top or bottom performers, plotting the group mean, applying heatmap/gradient coloring, generating a table with calculations like beta, correlation, and RSI, creating a profile to show asset distribution around the mean, and much more.
One of the most important script tools is the screener table, which can display:
🔸 Percentage Change (Represents the return or the percentage increase or decrease in Price/OI/OBV over the current selected period)
🔸 Beta (Represents the sensitivity or responsiveness of asset's returns to the returns of a benchmark/mean. A beta of 1 means the asset moves in tandem with the market. A beta greater than 1 indicates the asset is more volatile than the market, while a beta less than 1 indicates the asset is less volatile. For example, a beta of 1.5 means the asset typically moves 150% as much as the benchmark. If the benchmark goes up 1%, the asset is expected to go up 1.5%, and vice versa.)
🔸 Correlation (Describes the strength and direction of a linear relationship between the asset and the mean. Correlation coefficients range from -1 to +1. A correlation of +1 means that two variables are perfectly positively correlated; as one goes up, the other will go up in exact proportion. A correlation of -1 means they are perfectly negatively correlated; as one goes up, the other will go down in exact proportion. A correlation of 0 means that there is no linear relationship between the variables. For example, a correlation of 0.5 between Asset A and Asset B would suggest that when Asset A moves, Asset B tends to move in the same direction, but not perfectly in tandem.)
🔸 RSI (Measures the speed and change of price movements and is used to identify overbought or oversold conditions of each asset. The RSI ranges from 0 to 100 and is typically used with a time period of 14. Generally, an RSI above 70 indicates that an asset may be overbought, while RSI below 30 signals that an asset may be oversold.)
⚙️ Settings Overview:
◽️ Period
Periodic inputs (e.g. daily, monthly, etc.) determine when the values are reset to zero and begin accumulating again until the period is over. This visualizes the net change in the data over each period. The input "Visible Range" is auto-adjustable as it starts the accumulation at the leftmost bar on your chart, displaying the net change in your chart's visible range. There's also the "Timestamp" option, which allows you to select a specific point in time from where the values are accumulated. The timestamp anchor can be dragged to a desired bar via Tradingview's interactive option. Timestamp is particularly useful when looking for outperformers/underperformers after a market-wide move. The input positioned next to the period selection determines the timeframe on which the data is based. It's best to leave it at default (Chart Timeframe) unless you want to check the higher timeframe structure of the data.
◽️ Data
The first input in this section determines the data that will be displayed. You can choose between Price, OI, and OBV. The second input lets you select which one out of the three asset groups should be displayed. The symbols in the asset group can be modified in the bottom section of the indicator settings.
◽️ Appearance
You can choose to plot the data in the form of lines, circles, areas, and columns. The colors can be selected by choosing one of the six pre-prepared color palettes.
◽️ Labeling
This input allows you to show/hide the labels and select their appearance and size. You can choose between Label (colored pointed label), Label and Line (colored pointed label with a line that connects it to the plot), or Text Label (colored text).
◽️ Smoothing
If selected, this option will smooth the values using a Simple Moving Average (SMA) with a custom length. This is used to reduce noise and improve the visibility of plotted data.
◽️ Highlight
If selected, this option will highlight the top and bottom N (custom number) plots, while shading the others. This makes the symbols with extreme values stand out from the rest.
◽️ Group Mean
This input allows you to select the data that will be considered as the group mean. You can choose between Group Average (the average value of all assets in the group) or First Ticker (the value of the ticker that is positioned first on the group's list). The mean is then used in calculations such as correlation (as the second variable) and beta (as a benchmark). You can also choose to plot the mean by clicking on the checkbox.
◽️ Profile
If selected, the script will generate a vertical volume profile-like display with 10 zones/nodes, visualizing the distribution of assets below and above the mean. This makes it easy to see how many or what percentage of assets are outperforming or underperforming the mean.
◽️ Gradient
If selected, this option will color the plots with a gradient based on the proximity of the value to the upper extreme, zero, and lower extreme.
◽️ Table
This section includes several settings for the table's appearance and the data displayed in it. The "Reference Length" input determines the number of bars back that are used for calculating correlation and beta, while "RSI Length" determines the length used for calculating the Relative Strength Index. You can choose the data that should be displayed in the table by using the checkboxes.
◽️ Asset Groups
This section allows you to modify the symbols that have been selected to be a part of the 3 asset groups. If you want to change a symbol, you can simply click on the field and type the ticker of another one. You can also show/hide a specific asset by using the checkbox next to the field.

TradeMaster ProTrading effectively requires a range of techniques, experience, and expertise. From technical analysis to market fundamentals, traders must navigate multiple factors, including market sentiment and economic conditions. However, traders often find themselves overwhelmed by market noise, making it challenging to filter out distractions and make informed decisions. To address this, we present a powerful indicator package designed to assist traders on their journey to success.
The TradeMaster indicator package encompasses a variety of trading strategies, including the SMC (Supply, Demand, and Price Action) approach, along with many other techniques. By leveraging concepts such as price action trading, support and resistance analysis, supply and demand dynamics, these indicators can empower traders to analyze entry and exit positions with precision. Unlike other forms of technical analysis that produce values or plots based on historical price data, Price Action brings you the facts straight from the source - the current price movements.
The indicator package consists of three powerful indicators that can be used individually or together to maximize trading effectiveness.
⭐ About the Pro Indicator
The Pro indicator is the cornerstone of the package, offering a comprehensive range of functions. It's strength lies in our unique structure calculation, which is based on real price action data, capturing every ticks from small intraday fluctuations to the significant high timeframe movements. The Pro Indicator reflects our personal use and deep comprehension of Smart Money Concepts. It provides streamlined tools for tracking algorithmic trends with modern visualizations, without unnecessary clutter.
In the ever-evolving trading landscape, mainstream methods and strategies can quickly become outdated as they are widely adopted. Liquidity is constantly sought after, and the best source for this is exploring and exploiting trading strategies that are widely accepted and applied. Currently, one of these strategies is the SMC (Supply, Demand, and Price Action).
It's no coincidence that our educational materials incorporate concepts such as liquidity grabs (LG) and Smart Money Traps (SMT). As the application of SMC gains popularity among retail traders, trading with this approach becomes more challenging. Therefore, the recent focus has been on reforming the SMC methodology, as it is the only method that relies on real price movements and will always work when applied correctly.
▸ What does proper application of SMC entail?
Many SMC traders associate their key areas of interest with the market structure, which is generally considered acceptable. However, depending solely on a single foundation can lead to significant deviations, which may cause notable impacts on trading results. Moreover, if the basis for the market structure calculation is inaccurate, the consequences can be even more severe. It's akin to risking money on a lottery ticket, believing it will be a winner.
Our methodology is different, and it may ensure longevity in the financial markets. The structure remains crucial, but it is not the sole foundation of everything; instead, it serves as a validation tool. Each calculation, such as order blocks (OB), Fair Value Gaps (FVG), liquidity grabs (LG), range analysis, and more, is independent and unique, separate from the structure. However, validation must ultimately come from the structure itself.
We employ individual and high-quality filters: before a function calculation is validated by the structure, it must undergo rigorous testing based on its own set of validation conditions. This approach aims to enhance robustness and accuracy, providing traders with a reliable framework for making informed trading decisions.
▸ An example for structure validation: Order Block with "Swing Sensitivity"
These order blocks will only be displayed and utilized by the script if there is a swing structure validation with a valid break. In other words, the presence of a confirmed swing Change of Character (ChoCh) or Break of Structure (BoS) is essential for the Order Block to be considered valid and relevant.
This approach ensures that the order blocks are aligned with the overall market structure and are not based on isolated or unreliable price movements. Whether it's Fair Value Gaps (FVG), Liquidity Grabs (LG), Range calculations, or other functionalities, the same underlying principle holds true. The background structure calculation serves as a validation mechanism for the data and insights generated by these functions, ensuring they adhere to the specific criteria and rules established within our methodology. By incorporating this robust validation process, traders can have confidence in the reliability and accuracy of the information provided by the indicator, allowing them to make informed trading decisions based on validated data and analysis.
👉 Usage - the general approach:
Determine your trading style using the Pro Indicator and build your basic strategy. This indicator helps you understand your trading style, whether it's swing trading, scalping or another approach. By analyzing the Pro Indicator, you gain valuable information about potential market trends, entry and exit points, and overall market sentiment.
👉 Example of usage:
In the following chart, you'll notice how we've utilized the indicator to formulate a strategic trading approach. We've employed Order Blocks equipped with volume parameters to identify crucial market zones. Simultaneously, we've leveraged swing/internal market structures to gain insights into potential long and short-term market turnarounds. Lastly, we've examined trend line liquidity zones to pinpoint probable impulses and breakouts within ongoing trends.
Now we can see how the price descended to the order block with the highest volume, which we had previously marked as our point of interest for an entry. As the price closed below the median Order Block, we noted its mitigation. After an internal CHoCH, it's directing us towards the main Order Block as a target.
👉 Smart Money Concepts Functions
Market Structure: identifies and marks key structural changes in the market, in order to visually highlight shifts in market trends and patterns. This feature is designed to alert you of significant changes in the market's behavior, signaling a potential shift from accumulation to distribution phase, or vice versa. It helps traders adapt their strategies based on evolving market dynamics.
Order Blocks: pinpoints crucial zones where large institutional investors ("smart money") have shown strong buying or selling interest recently. Order blocks can serve as a tool for identifying key levels for potential trade entries or exits.
FVGs (Fair Value Gaps): detects discrepancies between the perceived market value and actual market price, revealing potential areas for price correction. With its mitigation settings, you can fine-tune the FVG detection according to the magnitude of value misalignment you consider significant.
Liquidity Grabs: helps track "smart money" footprints by identifying levels where large institutional traders may have induced liquidity traps. Understanding these traps can aid in avoiding false market moves and optimizing trade entries.
Automatic Fibonacci Tool: Simplifying the task of identifying key Fibonacci retracement and extension levels, this tool ties Fibonacci levels to the structure for you. It aids in recognizing significant support and resistance levels, providing a clearer understanding of potential price movements.
The Smart Money Concepts trading strategy - combined with these dynamic features - becomes a powerful analytical asset for any trader, providing in-depth insights into market dynamics, trends, and potential opportunities.
👉 Algorithmic trend and dynamic support and resistance
Trend Rainbow: This proprietary feature uses our unique TRMA** method to define short-term, medium-term, and long-term market trends. It incorporates state-of-the-art visualization techniques to render the trend information in an intuitive, easily interpretable manner. It's a 21st-century tool designed for the modern trader who values both precision and simplicity.
Multi-Timeframe Moving Averages: This feature allows traders to simultaneously monitor moving averages across multiple timeframes, providing a comprehensive perspective on market trends. It helps identify dynamic support and resistance zones, key levels where price movements are likely to slow down or reverse. This function not only aids in planning potential trade entries and exits, but also calculates the precise percentage distance to these levels. Can be as well crucial for risk management, enabling traders to set stop losses and profit targets based on solid, data-driven analysis. The Multi-Timeframe Moving Averages function is a versatile tool that combines strategic planning and risk control into a single, easy-to-use feature.
👉 Unlock the Hidden Market Dynamics
Market Sessions: This feature - by default - provides a clear representation of the four major global trading sessions. Each session is distinctly marked on your trading chart, helping you visualize the specific time periods when these markets are most active. Recognizing these sessions is critical for understanding market dynamics, as the opening and closing of major markets can lead to significant price movements. Whether you're a day trader looking to exploit intra-day volatility or a long-term investor wanting to understand broader market trends, the Market Sessions feature can be a useful tool in your trading toolkit.
Divergence Functions: allow the use of unique indicators along with our proprietary ones to detect potential price reversals. As each asset has a different market maker, divergences can vary greatly across different charts and timeframes. With our Divergence Ranking Table, you can quickly determine which divergences have the highest success rates and which are the least successful on a given chart. This feature allows you to adapt your strategies to the most effective signals, enhancing your trading decisions and boosting your potential profits.
Volume Profile with delta: This feature may give traders an edge by providing an in-depth view of market activity. It illustrates the amount of trading volume at different price levels, combined with the 'delta', which is the difference between buying and selling volume. This information allows you to see areas of high trading activity and understand whether the volume is pushing the price up or down. This real-time insight into the market's supply and demand can be instrumental in identifying key support and resistance levels, predicting potential reversals, and recognizing where the market is likely to move. Similarly to Fibonacci tool, Volume Profile can be tied to the current market structure.
👉 Improve Trading Decisions
Range: This innovative feature assists traders in determining discount, premium, and equilibrium zones. It provides a unique way of visualizing price areas where a security could be overbought or oversold (premium or discount zones), and where the price is expected to be fair and balanced (equilibrium zone). Distance from current price is displayed in percentage terms, which can assist traders with crucial data for risk management and strategic planning. The Range function helps you identify the most favorable price zones for entries and set your stop-loss and take-profit levels more accurately.
Previous OHLC: This functionality offers the capability to display the previous Open, High, Low, Close values. It is primarily set on the daily timeframe and serves as an important reference for traders. Having an overview of these key levels from the previous day gives you a solid foundation on which to base today's trading decisions. Recognizing these levels can help you predict potential turning points in the market, providing an advantage in your trading strategy.
Smart Money Zones: our secret weapon for swing traders. Similarly to order blocks, these zones can accurately identify crucial areas of strong buying or selling interest by large institutional investors. However while Order Blocks focus on recent price action, Smart Money Zones take the whole chart into consideration, resulting in more established support and demand zones.
The summary graph combines six unique indicators (Momentum, Trend Strength, Volume, Volatility, Asset Strength, and Sentiment) along with Structure and Sessions. These indicators use our TRMA** method to provide a comprehensive overview of market dynamics. By consolidating these indicators into a single graph, traders can gain valuable insights into the overall market landscape.
** TRMA (Trend Rainbow Moving Averages) is a complex but customizable moving average matrix calculation that is designed to measure market trend direction, strength and shifting.
⭐ Conclusion
We hold the view that the true path to success is the synergy between the trader and the tool, contrary to the common belief that the tool itself is the sole determinant of profitability. The actual scenario is more nuanced than such an oversimplification. Our aim is to offer useful features that meet the needs of the 21st century and that we actually use.
🛑 Risk Notice:
Everything provided by trademasterindicator – from scripts, tools, and articles to educational materials – is intended solely for educational and informational purposes. Past performance does not assure future returns.

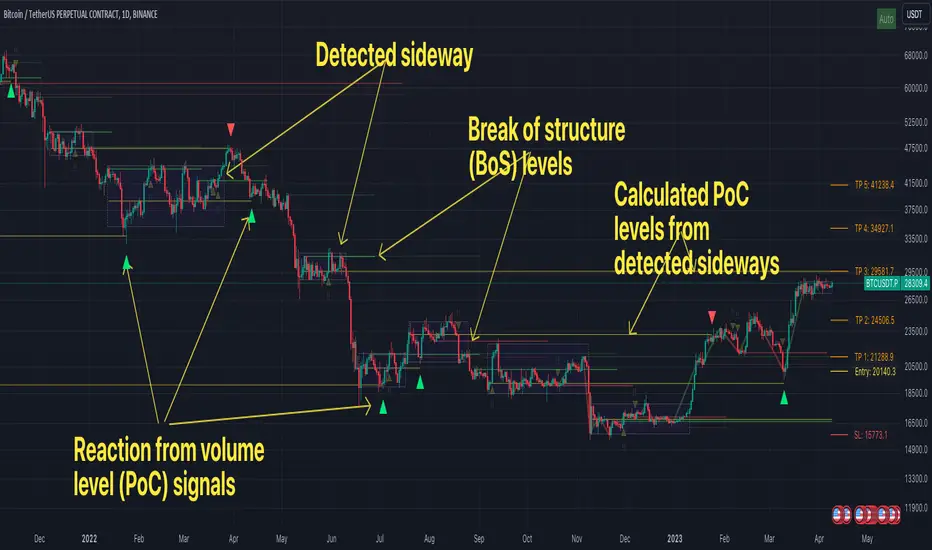
FFH Market structure v1The indicator determines the trend, its direction, confirmed trend, trend breakout levels (BoS), sideways ranges, volume profile point of control levels (vPoC) - all of this is conveniently displayed on the chart and helps complement your technical analysis.
The main idea of the script is to trade volume profile levels (vPoC) by identifying trends and sideways ranges. The script detect them and provides signals as soon as it detects a reaction from a volume level. You then complement these signals with your own technical analysis and make a decision to enter a trade. The script was developed solely to facilitate trading and address the issue of convenient visualization. Structure breakout levels are displayed as additional confirmations for making trading decisions. If we form a sideways range below/above such a trading level, it is a strong signal for me.
For sideways ranges, a volume level is calculated (vPoC), which also serves as input information for the signal engine. Signals are generated based on volume levels, with the calculation of stop loss (SL) and take profit (TP) levels. The SL is set at a certain percentage of the range boundaries or the previous high/low, as specified by a parameter. Targets are calculated intelligently based on trend reversal levels and volume levels.
The indicator parameters are individually tailored to each coin. The number of bars to determine the high/low is adjusted, as well as the allowable price deviation for defining the range boundaries on the first level. There are three modes for determining the sideways range, and data sources for highs/lows can be chosen (high/low/candle close, etc.). To make it more convenient for you to work with the indicator, there is an algorithm for automatic parameter adjustment built-in.
Currently script _only_ works for:
* BTC on 1-hour, 4-hour, and 1-day timeframes.
* ETC on 1-hour, 4-hour, and 1-day timeframes.
* Any altcoin on a 1-day timeframe.
The script will be beneficial to both novice traders, helping them understand market structure, sideways ranges, and identifying structure breakouts, as well as experienced traders, facilitating the process of plotting market structure elements on the chart and making trading decisions.
In any case, this script is not an investment idea.
All trading decisions you make based on the script are made independently and at your own risk.
Supply and Demand Daily [LuxAlgo]The Supply and Demand Daily indicator displays daily supply and demand areas on the user's chart. These areas are constructed using the market data within a previous daily interval.
This script makes use of the same logic as our previous Supply and Demand Visible Range indicator .
🔶 USAGE
The supply/demand areas & levels displayed by the indicator aim to provide potential support/resistance levels for users. Supply areas highlight where buyers are willing to exit the market and sell the asset, thus providing resistance and potentially causing prices to reverse or bounce back downwards, while demand areas highlights where buyers were willing to purchase the asset, thus providing support and potentially causing prices to reverse or bounce back upwards.
Historical areas allow the user to study the evolution of supply/demand from one day to another. Wider areas highlight prices avoiding reverting to this area, while thinner areas highlight prices returning more frequently to them.
Trends can be determined by looking at the price position relative to the previous day's supply/demand areas. Price breaking down from the demand zone is indicative of a downtrend, while price breaking above the supply zone is indicative of an uptrend.
Pullback/throwback scenarios can also be common using this indicator.
🔶 SETTINGS
Threshold %: Percentage of the total visible range volume used as a threshold to set supply/demand areas. Higher values return wider areas.
Resolution: Determines the number of bins used to find each area. Higher values will return more precise results.
Intra-bar TF: Timeframe used to obtain intra-bar data.
🔶 RELATED SCRIPTS

OBVoscillatorTitle: OBV Oscillator
Author: OsborneCapital
The OBV (On Balance Volume) Oscillator developed by OsborneCapital is a distinctive variant from commonly published OBV indicators. This script capitalizes on the primary concept of the OBV, which is to cumulatively add or subtract the entire volume of each bar to a total, based on whether the closing price was higher or lower than the previous close. However, the OBV Oscillator by OsborneCapital improves upon this by introducing an additional layer of analysis.
Key Differences:
Oscillator Formulation:
The original OBV serves as a cumulative measure of buying and selling pressure. It does not naturally oscillate around a zero line. This script transforms OBV into an oscillator, offering a normalized view around a baseline (zero) for a more intuitive interpretation of buying and selling pressure.
Normalized Scaling:
The OBV Oscillator scales the OBV values down by a user-defined factor (default 1000), helping adapt the indicator to the magnitudes of the underlying market's volume profile.
Moving Average Comparison:
This script compares the scaled OBV with a Moving Average (MA) over a user-defined period, enhancing the visibility of divergences and convergences between volume trends and price action.
Usage:
The OBV Oscillator by OsborneCapital provides visual cues about the underlying buying or selling pressure, which is not directly visible from the price chart:
- Above zero line: Suggests the dominance of buying pressure, which may indicate an ongoing bullish sentiment.
- Below zero line: Indicates the dominance of selling pressure, hinting at bearish sentiment.
- Crossing the zero line: A change in the trend's direction, from bullish to bearish or vice versa.
Markets and Conditions:
The OBV Oscillator can be used across various markets, including but not limited to stocks, forex, cryptocurrencies, commodities, and futures. As this script fundamentally builds on volume analysis, it tends to be more effective in markets where volume information is reliable and significant.
It's always recommended to use this tool in conjunction with other indicators and analysis methods, as it mainly provides insights into volume trends and doesn't consider price levels or price-based trends. The indicator can be particularly effective in identifying potential breakouts when there's a divergence between the OBV Oscillator and the price trend.
Please remember, no indicator alone can guarantee success in trading, and a comprehensive approach, including risk management, should always be employed.

Modified TradingView's Up/Down Volume [vnhilton]
When plotting columns, histograms, etc. You'll notice that the indicator does not stick to the bottom of the pane. To fix this, you need another indicator (we'll call this 'placeholder') in the same pane as this indicator. Pin the placeholder indicator to the left scale, & pin the main indicator to the left scale. Then, pin the placeholder indicator to scale A, & finally the main indictor to the right scale.
Note: On the daily timeframes & higher, the up/down volume isn't accurate. Therefore, I've added a feature where you can toggle on the main indicator to disappear & only show ordinary total volume similar to the TradingView volume indicator.
The original code belongs to TradingView. This is a modified indicator that displays the down volume above the up volume similar to the volume profile. Also includes a moving average using the total volume, & a feature to display ordinary volume to solve the up/down inaccuracies on the daily timeframe & higher.

Vwap based Supply and Demand Heatmap_V1This is a Multi-time frame "Thermographic Vwap based heatmap" showing Highest volume Vwap supply and demand zones.
User has 3 inputs for time frames to choose from or layer. It comes preset with "Short" and "Mid" time frame enabled and user can choose to add an additional layer if they would like for longer time frame analysis. If ALL time frames are enabled, fewer levels will show overall due to the 500 map limit, But zones will become brighter, larger, and more "precise" as they overlap and seek out the highest volume concentration amongst all levels.
What is the map showing you?
The heat map goes through each user selected time frame and searches for the highest volume candle and plots a zone based of that candles Vwap and high. These zones act as dynamic support and resistance. Each zone will "Degrade" and disappear over time and show positive when price has broken, cleared and held above it. The shift in color however is not immediate in change, rather transitional, so as not to "Repaint" causing false sense of clearing a zone. All negative zones (Price below) are colored red. User can choose to change any of the maps color's if they would like.
Time frame MUST be larger than your current charts resolution.-
Example- If on a 3min chart, user would choose any time frame LARGER than 3 min to display a map from.
Time frames the zones work best on are 1,3,5,15 min, paired with maps such as "Daily, Weekly, 240min(4hr), 60min" etc for intraday scalping or trend style trading. If on a larger time frame, 60mi, 4hr, Daily, user would choose larger maps like Daily, Weekly, monthly only. User can choose to display all, or just one time frame's zone at a time if they would like. If on a smaller intraday chart, You can start with "Daily" map first, increase opacity if the map is to dark. Then add additional time frames up or down in time if you'd like so long as maps time frame is larger than the charts.
If on a 1, 3, or 5min chart, you can also try the 30,60, or 240min maps for finer granularity and "Scalping" support and resistance.
If you choose a set of time frames, and do not see maps interacting with current price, then cycle out to a higher chart time frame and maps that are one or two time frames higher than current chart resolution.
These maps are showing you where supply and demand are situated since they are looking for the "Highest Volume" candles in each time frame you choose-
The range cast from the highest volume launch candle have proven to be strong support or resistance. Think of "Trapped trader's" if viewing over head supply level's, these traders will sell into a push higher until cleared. Vice versa, if viewing a demand level below, think of a "Base", especially on higher time frames. An area of high volume participation, where buyer's have shown support, and launched a run from. When price cycles back to these zone's, one would expect support from them.
Each zone has a high or low, you will often see price discovery "Test" the high and low of each zone. Probing as they say in Auction market theory to see if there are still buyers, or seller's present. I will often wait for the probe of the high or low of a zone, then look to participate once they have wicked the area and cleared the inventory there and start to move to the opposing side of the zone I am looking to participate in. Think of "Value low, and Value high" in market or volume profile. Market maker's aim to test the participants "Max pain", and absorb stops in each direction. With that said the maps are not meant to be "Lines in the sand" or concrete level's, they are simply hot or cold zones where you could expect participation to happen, the "Hotter" or "Brighter" a zone is the higher the volume concentration is there at that price area. So act accordingly and use this as an addition to your analysis, not the ONLY thing you take into consideration.
With that said, Trading is RISKY, The creator of this code is NOT a licensed professional, and this tool, nor description is meant to be trading or financial advice! The user whom downloads this tool assumes ALL responsibility and liability associated with the financial risk that comes with the use of this analysis tool and trading in general. The creator of the code advises all users to do their due diligence and contact a licensed broker dealer before making ANY financial decision's based off of analysis done with this tool.
Any question's, Comments or concerns feel free to message via Tradingview platform.
Enjoy-
JMF

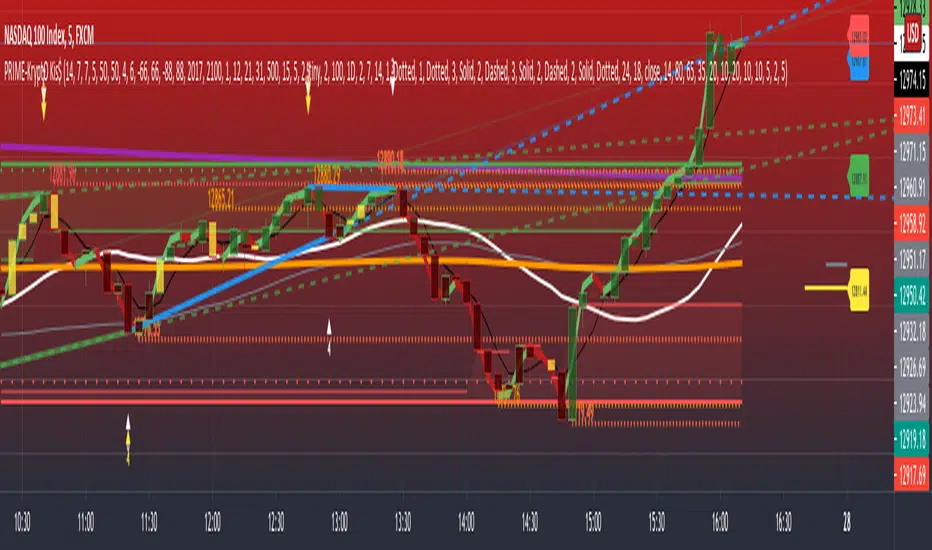
PRIME - Krypto Kiss+CCI+VPIntroducing from Prime Academy, the experimental "KryptO Kis$" algorithm, which combines our most powerful scripts all in one indicator. Available to the user are a full options platform to adjust parameters as well as individually blind indications for precise chart analysis. The following algorithms have been utilized:
* Prime Pulse (3 Candle System) - The original impulse and momentum indication system, it take rsi and tsi data to provide users with the indication of initial impulses, as well as a yellow candle to ascertain when there is a possible change of momentum in the current impulse.
* 5 SMA - The original Sniper Cross system seen from previous strategies, using the 4, 21, 50, 185, and 800 SMA's to determine changes of trend, continuation and support levels.
*CCI Indication on Chart - The system provides realtime CCI data in correlation to price positions within the general chart matrix, receiving system variables from various crosses on the 100 to -100 scale for CCI. Bullish and Bearish indications are clearly defined by separate colors.
* Volume Profile with tags - This system provides current volume data for the current time frame and sequence, also giving available tags at prices holding high volume orders, historically and present as indicated by the difference in length of indications. color saturations indicate the intensity of volume at the price in question .
* Shadow ZoneZ - Provides Support and resistance levels using rsi overbought and over sold data, sourced on the close of previous prices. Also embedded in the code is an additional volume confluence via indications of dotted lines with prices available, giving sequence positions of "Whales" and their support and resistance levels by order volume at price.
* An added bonus of the Shadow ZoneZ is the auto trend line and trend channel function , as well as the highlighted zones of liquidity waiting to be filled from previous impulses and lack of present retracements.
Any questions can be directed here on site via Direct Message. Any feedback is welcomed, and thank you in advance. Trade Well, Family!
- Dee Prime
//Disclaimer:
//Trading success is all about following your trading strategy and the indicators should fit within your trading strategy, and not to be traded upon solely
//The script is for informational and educational purposes only. Use of the script does not constitute professional and/or financial advice.
//You alone have the sole responsibility of evaluating the script output and risks associated with the use of the script.
//In exchange for using the script, you agree not to hold the publishing TradingView user liable for any possible claim for damages arising from any decision you make based on use of the script.
Elite Pip Academy - Price & Delta Divergence (Price Chart)🎓 ELITE PIP ACADEMY - PRICE & DELTA DIVERGENCE DETECTOR
This indicator identifies divergences between price action and cumulative delta volume, displaying them directly on your price chart for easy visual analysis.
═══════════════════════════════════════════════════
📱 JOIN OUR FREE COMMUNITY:
🔸 Instagram: @elite_pip_academy
www.instagram.com
→ Trading education, tips & market updates
🔸 Telegram Channel: FREE Market Analysis
→ Daily market analysis
→ Trading psychology
→ Educational content
→ Community support
Like, follow & share to support our educational mission! 📚
═══════════════════════════════════════════════════
📊 WHAT IT DOES:
Detects two types of divergences:
🟢 BULLISH DIVERGENCE:
- Price makes a lower low
- Delta (buying pressure) makes a higher low
- Suggests potential upward reversal
- Marked with green lines and labels
🔴 BEARISH DIVERGENCE:
- Price makes a higher high
- Delta (buying pressure) makes a lower high
- Suggests potential downward reversal
- Marked with red lines and labels
═══════════════════════════════════════════════════
⚙️ KEY FEATURES:
✓ Real-time divergence detection
✓ Customizable line styles (Solid, Dashed, Dotted)
✓ Adjustable line width (1-10)
✓ Color customization for both divergence types
✓ Toggle labels and lines on/off
✓ Adjustable pivot lookback period
✓ Clean, non-intrusive visual design
✓ Works on all timeframes
✓ Built-in alerts for divergence detection
✓ Elite Pip Academy branding with social links
═══════════════════════════════════════════════════
🎯 HOW TO USE:
1. Add this indicator to your price chart
2. Add the companion "Elite Pip Academy - Delta Divergence" indicator for the complete dual-view system
3. Customize colors, line styles, and width in the settings
4. Look for divergence lines connecting pivot points
5. Green lines = Bullish divergence (potential buy opportunity)
6. Red lines = Bearish divergence (potential sell opportunity)
7. Set up alerts to be notified when divergences appear
8. Follow us on Instagram & Telegram for more educational content!
═══════════════════════════════════════════════════
⚡ SETTINGS:
📊 Detection Settings:
- Pivot Lookback: Number of bars to identify pivots (default: 5)
👁️ Display Options:
- Toggle bullish/bearish divergences
- Show/hide labels and lines
🟢 Bullish Divergence Style:
- Color selection
- Line width (1-10)
- Line style (Solid/Dashed/Dotted)
🔴 Bearish Divergence Style:
- Color selection
- Line width (1-10)
- Line style (Solid/Dashed/Dotted)
═══════════════════════════════════════════════════
💡 TRADING TIPS:
- Divergences work best at key support/resistance levels
- Combine with volume profile for confirmation
- Wait for price confirmation before trading
- Use multiple timeframes for stronger signals
- Not all divergences lead to reversals
- Always use proper risk management
Join our Telegram for daily examples and trading psychology tips!
═══════════════════════════════════════════════════
📚 RECOMMENDED SETUP:
For complete analysis, use BOTH indicators:
1. "Elite Pip Academy - Price Divergence" (this indicator) - on main chart
2. "Elite Pip Academy - Delta Divergence" - in separate pane below
This dual-view setup shows divergences on both price and delta simultaneously.
═══════════════════════════════════════════════════
🎓 FREE EDUCATIONAL RESOURCES:
Follow Elite Pip Academy for:
📱 Instagram (@elite_pip_academy):
• Daily trading tips
• Chart examples
• Educational posts
• Market insights
• Community highlights
💬 Telegram:
• Free market analysis
• Trading psychology
• Strategy discussions
• Q&A sessions
• Educational materials
═══════════════════════════════════════════════════
⚠️ IMPORTANT DISCLAIMER:
This indicator is provided for EDUCATIONAL PURPOSES ONLY.
- NOT financial advice
- NOT investment advice
- NOT a signal service
- NOT a guarantee of profits
Trading and investing involve substantial risk of loss. Past performance does not guarantee future results. This tool is designed to help you understand market dynamics and should be used as part of a comprehensive trading education.
Always:
✓ Do your own research
✓ Understand the risks
✓ Use proper risk management
✓ Practice on demo accounts first
✓ Consult with qualified financial advisors before making trading decisions
Elite Pip Academy and the creators of this indicator assume no responsibility for any trading losses incurred through the use of this tool.
═══════════════════════════════════════════════════
🎓 ABOUT ELITE PIP ACADEMY:
Elite Pip Academy is dedicated to providing high-quality educational resources for traders at all levels. Our tools are designed to help you learn, practice, and understand market mechanics.
Our mission: Education over profits. Knowledge over hype. Community over competition.
═══════════════════════════════════════════════════
📱 CONNECT WITH US:
Instagram: @elite_pip_academy
Link: www.instagram.com
Telegram: Elite Pip Academy
(Free market analysis & trading psychology)
Like our Instagram posts and share with fellow traders!
Your support helps us create more free educational content. 🙏
═══════════════════════════════════════════════════
✅ VERSION: 1.0
📅 RELEASE DATE: February 2026
🔧 COMPATIBLE WITH: TradingView Pine Script v5
📊 WORKS ON: All markets, all timeframes
═══════════════════════════════════════════════════
Tags: divergence, delta, volume, price action, reversal, educational, trading education, technical analysis, cumulative delta, volume profile, elite pip academy, trading community, free telegram, instagram trading

Volume footprint by MH RaajThis is for the pro traders who work with volume footprint chart. it includes a complete package of -
1. Footprint chart.
2. Volume profile.
3. Total volume of every single candle.
4. Delta volume.
which can help a traders exactly what is happening in a specific price level on higher time frame and lower time frame. using this multi purpose indicator, you can take a perfect entry where the market makers or big players are interest to buy or sell. to know the strategy or how to use this fantastic combo indicator, follow me on YT or in telegram
Youtube : www.youtube.com
Telegram : t.me/ dJyewRuz6lQ5ZmNl

Liquidity-Weighted RSILW-RSI scales the classic RSI by relative volume to highlight when momentum happens under unusually high participation.
Formula:
LW-RSI = RSI × (Current Volume / 20-bar Avg Volume)
• The 0 → Threshold band marks the “normal” zone.
• Values above Threshold indicate an abnormal liquidity/participation regime (not a buy/sell signal by itself).
• The orange line is the moving average of LW-RSI itself to show whether participation spikes are persistent or just noise.
LW-RSI does not predict direction. Use it as a context/confirmation tool alongside structure, VWAP, and volume profile.

VTRADEVTRADE — это overlay-инструмент для графика, который объединяет сигнальные модули и контекст рынка в одном скрипте. Он создан для трейдеров, которым важны чистый график, наглядные подсказки и возможность быстро настроить отображение под свой стиль торговли.
Ключевые возможности
Два независимых блока сигналов:
VTRADE-1 — более избирательные сигналы (акцент на качество).
VTRADE-Pulse — более быстрые и реактивные сигналы (акцент на своевременность).
Наглядная визуализация:
Сигнальные вертикальные линии и метки на графике.
Гибкие переключатели отображения, чтобы оставлять только нужное.
Дополнительный контекст:
Bollinger Bands со встроенной подсветкой Squeeze (зоны потенциального расширения волатильности).
HVP (Volume Profile) для выделения ключевых объёмных уровней.
MA (до 4 линий) для ориентира по тренду.
Польза:
Быстрое чтение рынка: сигнал + контекст (волатильность/объём/тренд).
Меньше визуального шума за счёт гибких настроек.
Удобно для работы через TradingView Alerts.
Важно: скрипт публикуется как Invite-Only. Внутренняя методология является авторской и не раскрывается.
-----
ENG:
VTRADE is an overlay chart tool that combines signal modules and market context in a single script. It’s built for traders who value a clean chart, clear visual cues, and the ability to quickly tailor what’s displayed to their trading style.
Key features
Two independent signal blocks:
VTRADE-1 — more selective signals (focus on quality).
VTRADE-Pulse — faster, more reactive signals (focus on timing).
Clear visualization:
Signal vertical lines and labels on the chart.
Flexible display toggles so you can keep only what you need.
Additional context:
Bollinger Bands with built-in Squeeze highlighting (areas of potential volatility expansion).
HVP (Volume Profile) to highlight key volume-based levels.
MA (up to 4 lines) for trend guidance.
Benefits:
Faster market reading: signal + context (volatility/volume/trend).
Less visual noise thanks to flexible settings.
Convenient for use with TradingView Alerts.
Important: the script is published as Invite-Only. The internal methodology is proprietary and is not disclosed.

NQ 2026 Strategic Levels + Market MemoryTitle: NQ Strategic Levels 2026: Volume Profile & Market Memory
Description: This indicator plots the critical institutional levels for NQ (Nasdaq-100) heading into 2026. It is designed to help traders visualize the "Market Structure" map based on the 2025 yearly volume profile and key historical events.
How it Works: The script projects three dynamic "Zones" and three fixed "Historical Markers" to the right of your chart. It does not clutter the past price action; it focuses on future price discovery.
1. The 2026 Active Zones (Boxes):
🛑 Resistance (Supply Zone): Derived from the "Trapped Buyers" of late 2025. This is where overhead supply is likely to cause profit-taking.
⚖️ The Pivot (Equilibrium): Based on the Q4 2025 High Volume Node (HVN). This is the "Line in the Sand." Above this zone, the weekly bias is Bullish. Below it, the bias shifts to Bearish/Correction.
💰 The Buy Zone (Support): The Yearly Value Area Low (VAL). This represents the strongest institutional support and a high-probability area for "Buy the Dip" programs.
2. The 2025 Market Memory (Dashed Lines):
Triple Witch Liquidity: The December 2025 rejection high.
AI Summer Breakout: The key breakout level from mid-2025 that flipped from resistance to support.
Tariff Scare Floor: The macro bottom established during the volatility of April 2025.
How to Use:
Trend Followers: Watch the Pivot Zone. If price holds above it, target the Resistance Zone.
Mean Reversion Traders: Look for rejections at the Resistance Zone or bounces at the Buy Zone.
Risk Management: Use the Historical Markers as invalidated points or profit targets.
Disclaimer: These levels are based on volume analysis and historical price action. Not financial advice. Trade at your own risk.

Clock&Flow: Elements of Cycle Analysis 2nd partClock&Flow – Elements of Cycle Analysis (ECA) | Complete Suite
Elements of Cycle Analysis (ECA) is an advanced cyclic analysis suite designed to interpret the market through time, structure, strength, and energy, combining cycles, volatility, and participation into a single operational framework.
The suite consists of two complementary modules:
🔹ECA 1 – Cycles, Structure, and Volatility (Overlay: True)
ECA 1 is dedicated to the structural and temporal analysis of the market.
Cyclic SMAs (Cyclic Ratio) Moving averages are calibrated according to nominal cycles and timeframes to monitor multiple cycles simultaneously (from the lower cycle to the upper cycles). Crossovers between fast and slow SMAs certify the closing or transition of the cycle related to the faster SMA. The specific cycle is identified in the Info Table at the bottom right (for 15m - 1h - 2h - 1D timeframes). You can select the number of cycles to observe and the asset type to apply them to:
Index: Standard quotes (e.g., Cash sessions).
Future: Extended quotes (24h).
50-200: Classic institutional references for the medium-long term.
ATR-based Dynamic Cyclic Channels The channels represent a lower cycle and its upper counterpart; their width is determined by the observed timeframe and calculated based on average volatility (ATR). Volatility is not treated as noise but as a structural component of the cycle, essential for contextualizing excesses, compressions, and expansions.
Info Table and Quick Guide Dynamic tables automatically link SMAs, timeframes, and time cycles, providing an immediate reading of the current cyclic context.
Time Bands (Weekly / Daily) Temporal visualization helps identify cyclic pivots and rhythm transitions.
🔹 ECA 2 – Market Excesses, Strength, and Energy
ECA 2 analyzes how the market moves within the cyclic structure.
Excesses and Divergences (Cyclic Stochastic) An oscillator calibrated on the same cyclic ratio as the suite. Crossovers between the lower cycle (blue) and upper cycle (red) signal potential phase changes. In areas of excess, divergences often confirm the closing and restart of a cycle.
Directional Movement System (DMS) The ADX measures the strength of the movement, while +DI and -DI indicate direction. A simultaneous crossover of ADX, +DI, and -DI signals imminent acceleration, even before the strength is fully expressed.
Market Pulse – Real Market Energy The Market Pulse measures the amount of real energy moving through the market by relating three factors:
Price Velocity
Normalized Volume
Volatility (ATR relative to price)
These three factors are combined multiplicatively: if one is missing, the impulse weakens. The zero line represents a state of energy equilibrium; values above or below indicate a real imbalance (bullish or bearish). Note: Market Pulse is not a classic oscillator and should not be interpreted as overbought or oversold; it is used to evaluate the energetic quality of a movement.
Operational Convergence
The maximum operational effectiveness of the ECA suite is achieved when all modules converge on the same market phase.
When cyclic timing, volatility, price structure, trend strength, and movement energy align, the context signals a high-probability operational phase. The system is applicable to any timeframe or asset because it is not bound by dogmatic or subjective interpretations of technical or fundamental analysis; instead, it leverages what is actually happening in the market. Major chart patterns and Volume Profile (technically not includable in this specific suite) provide further confirmation.
Under these conditions, the signal does not originate from a single indicator but from the consistency of the entire system: time, volatility, and energy moving in the same direction.
Entries should always be accompanied by proper risk management.
––––––––––––––––––––––––––––––––––––––––––––––––––––––––––––––––––––––––
Clock&Flow – Elements of Cycle Analysis (ECA) | Suite Completa
Elements of Cycle Analysis (ECA) è una suite avanzata di analisi ciclica progettata per leggere il mercato attraverso tempo, struttura, forza ed energia, combinando cicli, volatilità e partecipazione in un unico framework operativo.
La suite è composta da due moduli complementari:
🔹 ECA 1 – Cicli, Struttura e Volatilità (overlay true)
ECA 1 è dedicato all’analisi strutturale e temporale del mercato.
SMA cicliche (ratio ciclica)
Le medie mobili sono calibrate in funzione dei cicli nominali e del timeframe per monitorare più cicli simultaneamente (dal ciclo inferiore fino ai cicli superiori).
Gli incroci tra SMA veloci e lente certificano la chiusura o transizione del ciclo correlato alla SMA più veloce. Il ciclo in questione è segnalato nella info table in basso a destra (per i time frame 15’ - 1h - 2h - 1D) Puoi selezionare il numero dei cicli da osservare e su quali asset applicarle (Index = quotazioni standard / Future = quotazioni estese / 50-200 i classici riferimenti istituzionali per il medio-lungo periodo
Canali ciclici dinamici basati su ATR
I canali rappresentano un ciclo inferiore e il suo superiore, l’ampiezza è data dal time frame osservato e calcolata sulla volatilità media (ATR).
La volatilità non è trattata come rumore, ma come componente strutturale del ciclo, utile per contestualizzare eccessi, compressioni ed espansioni.
Info Table e Quick Guide
Tabelle dinamiche collegano automaticamente SMA, timeframe e cicli temporali, fornendo una lettura immediata del contesto ciclico in corso.
Time Bands (Weekly / Daily)
La visualizzazione temporale aiuta a individuare pivot ciclici e transizioni di ritmo.
––––––––––––––––––––––––––––––––––––––––––––––––––––––––––––––––––––––
🔹 ECA 2 – Eccessi, Forza ed Energia del Mercato
ECA 2 analizza come il mercato si muove all’interno della struttura ciclica.
Eccessi e divergenze (Stochastic ciclico)
Oscillatore calibrato sulla stessa ratio ciclica della suite.
Gli incroci tra ciclo inferiore (blu) e superiore (rosso) segnalano potenziali cambi di fase; in area di eccesso, le divergenze certificano spesso la chiusura e ripartenza del ciclo.
Directional Movement System (DMS)
L’ADX misura la forza del movimento, mentre +DI e –DI ne indicano la direzione.
L’incrocio simultaneo di ADX, +DI e –DI segnala un’accelerazione imminente, anche in assenza di forza già espressa.
Market Pulse – Energia reale del mercato
Il Market Pulse misura quanta energia reale sta attraversando il mercato mettendo in relazione:
velocità del prezzo
volume normalizzato
volatilità (ATR rapportato al prezzo)
I tre fattori sono combinati in modo moltiplicativo: se uno manca, l’impulso si indebolisce.
La linea dello zero rappresenta una condizione di equilibrio energetico; valori sopra o sotto indicano uno sbilanciamento reale, rialzista o ribassista.
Il Market Pulse non è un oscillatore classico e non va interpretato in termini di ipercomprato o ipervenduto: serve a valutare la qualità energetica del movimento.
La massima efficacia operativa della suite ECA si ottiene quando tutti i moduli convergono sulla stessa fase di mercato.
Quando tempi ciclici, volatilità, struttura del prezzo, forza del trend ed energia del movimento risultano allineati, il contesto segnala una fase ad alta probabilità operativa.
È applicabile su qualunque time frame o asset perché non è vincolato a dogmatiche e soggettive interpretazioni di analisi tecnica - fondamentale ma sfrutta ciò che realmente sta accadendo sul mercato.
I principali pattern grafici e il Volume Profile (in questa suite tecnicamente non inseribili) forniscono ulteriori conferme e/o indicazioni.
In queste condizioni il segnale non nasce da un singolo indicatore, ma dalla coerenza dell’intero sistema: tempo, volatilità ed energia si muovono nella stessa direzione.
Gli ingressi vanno sempre accompagnati da una corretta gestione del rischio.

Clock&Flow: Elements of Cycle Analysis 1st partClock&Flow – Elements of Cycle Analysis (ECA) | Complete Suite
Elements of Cycle Analysis (ECA) is an advanced cyclic analysis suite designed to interpret the market through time, structure, strength, and energy, combining cycles, volatility, and participation into a single operational framework.
The suite consists of two complementary modules:
🔹 ECA 1 – Cycles, Structure, and Volatility (Overlay: True)
ECA 1 is dedicated to the structural and temporal analysis of the market.
Cyclic SMAs (Cyclic Ratio) Moving averages are calibrated according to nominal cycles and timeframes to monitor multiple cycles simultaneously (from the lower cycle to the upper cycles). Crossovers between fast and slow SMAs certify the closing or transition of the cycle related to the faster SMA. The specific cycle is identified in the Info Table at the bottom right (for 15m - 1h - 2h - 1D timeframes). You can select the number of cycles to observe and the asset type to apply them to:
Index: Standard quotes (e.g., Cash sessions).
Future: Extended quotes (24h).
50-200: Classic institutional references for the medium-long term.
ATR-based Dynamic Cyclic Channels The channels represent a lower cycle and its upper counterpart; their width is determined by the observed timeframe and calculated based on average volatility (ATR). Volatility is not treated as noise but as a structural component of the cycle, essential for contextualizing excesses, compressions, and expansions.
Info Table and Quick Guide Dynamic tables automatically link SMAs, timeframes, and time cycles, providing an immediate reading of the current cyclic context.
Time Bands (Weekly / Daily) Temporal visualization helps identify cyclic pivots and rhythm transitions.
🔹 ECA 2 – Market Excesses, Strength, and Energy
ECA 2 analyzes how the market moves within the cyclic structure.
Excesses and Divergences (Cyclic Stochastic) An oscillator calibrated on the same cyclic ratio as the suite. Crossovers between the lower cycle (blue) and upper cycle (red) signal potential phase changes. In areas of excess, divergences often confirm the closing and restart of a cycle.
Directional Movement System (DMS) The ADX measures the strength of the movement, while +DI and -DI indicate direction. A simultaneous crossover of ADX, +DI, and -DI signals imminent acceleration, even before the strength is fully expressed.
Market Pulse – Real Market Energy The Market Pulse measures the amount of real energy moving through the market by relating three factors:
Price Velocity
Normalized Volume
Volatility (ATR relative to price)
These three factors are combined multiplicatively: if one is missing, the impulse weakens. The zero line represents a state of energy equilibrium; values above or below indicate a real imbalance (bullish or bearish). Note: Market Pulse is not a classic oscillator and should not be interpreted as overbought or oversold; it is used to evaluate the energetic quality of a movement.
Operational Convergence
The maximum operational effectiveness of the ECA suite is achieved when all modules converge on the same market phase.
When cyclic timing, volatility, price structure, trend strength, and movement energy align, the context signals a high-probability operational phase. The system is applicable to any timeframe or asset because it is not bound by dogmatic or subjective interpretations of technical or fundamental analysis; instead, it leverages what is actually happening in the market. Major chart patterns and Volume Profile (technically not includable in this specific suite) provide further confirmation.
Under these conditions, the signal does not originate from a single indicator but from the consistency of the entire system: time, volatility, and energy moving in the same direction.
Entries should always be accompanied by proper risk management.
––––––––––––––––––––––––––––––––––––––––––––––––––––––––––––––––––––––––
Clock&Flow – Elements of Cycle Analysis (ECA) | Suite Completa
Elements of Cycle Analysis (ECA) è una suite avanzata di analisi ciclica progettata per leggere il mercato attraverso tempo, struttura, forza ed energia, combinando cicli, volatilità e partecipazione in un unico framework operativo.
La suite è composta da due moduli complementari:
🔹 ECA 1 – Cicli, Struttura e Volatilità (overlay true)
ECA 1 è dedicato all’analisi strutturale e temporale del mercato.
SMA cicliche (ratio ciclica)
Le medie mobili sono calibrate in funzione dei cicli nominali e del timeframe per monitorare più cicli simultaneamente (dal ciclo inferiore fino ai cicli superiori).
Gli incroci tra SMA veloci e lente certificano la chiusura o transizione del ciclo correlato alla SMA più veloce. Il ciclo in questione è segnalato nella info table in basso a destra (per i time frame 15’ - 1h - 2h - 1D) Puoi selezionare il numero dei cicli da osservare e su quali asset applicarle (Index = quotazioni standard / Future = quotazioni estese / 50-200 i classici riferimenti istituzionali per il medio-lungo periodo
Canali ciclici dinamici basati su ATR
I canali rappresentano un ciclo inferiore e il suo superiore, l’ampiezza è data dal time frame osservato e calcolata sulla volatilità media (ATR).
La volatilità non è trattata come rumore, ma come componente strutturale del ciclo, utile per contestualizzare eccessi, compressioni ed espansioni.
Info Table e Quick Guide
Tabelle dinamiche collegano automaticamente SMA, timeframe e cicli temporali, fornendo una lettura immediata del contesto ciclico in corso.
Time Bands (Weekly / Daily)
La visualizzazione temporale aiuta a individuare pivot ciclici e transizioni di ritmo.
––––––––––––––––––––––––––––––––––––––––––––––––––––––––––––––––––––––
🔹 ECA 2 – Eccessi, Forza ed Energia del Mercato
ECA 2 analizza come il mercato si muove all’interno della struttura ciclica.
Eccessi e divergenze (Stochastic ciclico)
Oscillatore calibrato sulla stessa ratio ciclica della suite.
Gli incroci tra ciclo inferiore (blu) e superiore (rosso) segnalano potenziali cambi di fase; in area di eccesso, le divergenze certificano spesso la chiusura e ripartenza del ciclo.
Directional Movement System (DMS)
L’ADX misura la forza del movimento, mentre +DI e –DI ne indicano la direzione.
L’incrocio simultaneo di ADX, +DI e –DI segnala un’accelerazione imminente, anche in assenza di forza già espressa.
Market Pulse – Energia reale del mercato
Il Market Pulse misura quanta energia reale sta attraversando il mercato mettendo in relazione:
velocità del prezzo
volume normalizzato
volatilità (ATR rapportato al prezzo)
I tre fattori sono combinati in modo moltiplicativo: se uno manca, l’impulso si indebolisce.
La linea dello zero rappresenta una condizione di equilibrio energetico; valori sopra o sotto indicano uno sbilanciamento reale, rialzista o ribassista.
Il Market Pulse non è un oscillatore classico e non va interpretato in termini di ipercomprato o ipervenduto: serve a valutare la qualità energetica del movimento.
La massima efficacia operativa della suite ECA si ottiene quando tutti i moduli convergono sulla stessa fase di mercato.
Quando tempi ciclici, volatilità, struttura del prezzo, forza del trend ed energia del movimento risultano allineati, il contesto segnala una fase ad alta probabilità operativa.
È applicabile su qualunque time frame o asset perché non è vincolato a dogmatiche e soggettive interpretazioni di analisi tecnica - fondamentale ma sfrutta ciò che realmente sta accadendo sul mercato.
I principali pattern grafici e il Volume Profile (in questa suite tecnicamente non inseribili) forniscono ulteriori conferme e/o indicazioni.
In queste condizioni il segnale non nasce da un singolo indicatore, ma dalla coerenza dell’intero sistema: tempo, volatilità ed energia si muovono nella stessa direzione.
Gli ingressi vanno sempre accompagnati da una corretta gestione del rischio.

Peter's Value area IndicatorDisplays key price levels as horizontal dashed lines extending to the right, with labels positioned on the right side:
dVWAP: Current daily Volume Weighted Average Price
mVWAP: Current monthly Volume Weighted Average Price
PDH / PDL: Previous Day High and Low
PWH / PWL: Previous Week High and Low
pdVAH: Previous Day Value Area High (~70% volume profile)
dVAH: Current Day Value Area High (~70% volume profile)
Lines are anchored to the visible chart area and update dynamically. Customizable colors, label offset, and line extension length via inputs.
Clean and minimal overlay for identifying important support/resistance and value area levels.

DAF VP Lite🎁 Volume Profile Indicator
VP Lite is a lightweight volume profile indicator that helps you identify key price levels where significant trading activity occurred.
📍 Core Features
• POC (Point of Control): The price level with the highest volume
• VAH/VAL (Value Area High/Low): The boundaries that contain 70% of total volume
• IB (Initial Balance): Opening range reference
📊 Multi-Timeframe Support
Day / Week / Month / Quarter / Half-Year / Year
⸻
🎁 成交量分布指标
VP Lite 是一款轻量级成交量分布指标,帮助你识别成交密集的关键价格区域。
📍 核心功能
• POC(成交量控制点): 成交量最集中的价格
• VAH/VAL(价值区间高/低): 覆盖总成交量 70% 的上下边界
• IB(初始平衡区间): 开盘区间参考
📊 多周期支持
天 / 周 / 月 / 季度 / 半年 / 年

Wyckoff Method - Comprehensive Analysis# WYCKOFF METHOD - QUICK REFERENCE CHEAT SHEET
## 🟢 STRONGEST BUY SIGNALS
### 1. SPRING ⭐⭐⭐⭐⭐
- **What:** False breakdown below support on LOW volume
- **Look for:** Quick reversal, close above support
- **Entry:** When price closes back in range
- **Stop:** Below spring low
- **Target:** Top of range minimum
### 2. SOS (Sign of Strength) ⭐⭐⭐⭐
- **What:** Breakout above resistance on HIGH volume
- **Look for:** Wide spread up bar, strong close
- **Entry:** On breakout or wait for LPS pullback
- **Stop:** Below range top
- **Target:** Height of range projected up
### 3. SHAKEOUT ⭐⭐⭐⭐
- **What:** Sharp move below support with HIGH volume, immediate reversal
- **Look for:** Long lower wick, closes strong
- **Entry:** When price reclaims support
- **Stop:** Below shakeout low
- **Target:** Previous resistance
---
## 🔴 STRONGEST SELL SIGNALS
### 1. UTAD (Upthrust After Distribution) ⭐⭐⭐⭐⭐
- **What:** False breakout above resistance, quick rejection
- **Look for:** Spike high, weak close, often high volume
- **Entry:** When price closes back in range
- **Stop:** Above UTAD high
- **Target:** Bottom of range minimum
### 2. SOW (Sign of Weakness) ⭐⭐⭐⭐
- **What:** Breakdown below support on HIGH volume
- **Look for:** Wide spread down bar, weak close
- **Entry:** On breakdown or wait for LPSY rally
- **Stop:** Above range bottom
- **Target:** Height of range projected down
### 3. UPTHRUST ⭐⭐⭐⭐
- **What:** Move above resistance on LOW volume, weak close
- **Look for:** Long upper wick, closes in lower half
- **Entry:** When resistance holds
- **Stop:** Above upthrust high
- **Target:** Support level
---
## 📊 ACCUMULATION PHASES (Bottom Formation)
```
PHASE A: Stopping the Downtrend
├─ PS (Preliminary Support) - First buying
├─ SC (Selling Climax) - Panic bottom ⚠️ KEY EVENT
├─ AR (Automatic Rally) - Relief bounce
└─ ST (Secondary Test) - Retest SC low
PHASE B: Building the Cause
├─ Trading range forms
├─ Multiple tests of support
├─ Volume decreasing
└─ Absorption occurring
PHASE C: The Test
├─ SPRING - False breakdown ⚠️ KEY EVENT
└─ TEST - Support holds on low volume
PHASE D: Dominance Emerges
├─ SOS - Breakout ⚠️ KEY EVENT
├─ LPS - Last Point of Support (pullback)
└─ BU - Backup
PHASE E: Markup
└─ New uptrend, strong momentum
```
**Background Color:** Blue → Green (getting brighter)
**Action:** Buy in Phase C/D, Hold through Phase E
---
## 📊 DISTRIBUTION PHASES (Top Formation)
```
PHASE A: Stopping the Uptrend
├─ PSY (Preliminary Supply) - First selling
├─ BC (Buying Climax) - Euphoric top ⚠️ KEY EVENT
├─ AR (Automatic Reaction) - Sharp drop
└─ ST (Secondary Test) - Retest BC high
PHASE B: Building the Cause
├─ Trading range forms
├─ Multiple tests of resistance
├─ Demand being absorbed
└─ Volume patterns change
PHASE C: The Test
└─ UTAD - False breakout ⚠️ KEY EVENT
PHASE D: Dominance Emerges
├─ SOW - Breakdown ⚠️ KEY EVENT
└─ LPSY - Last Point of Supply (rally to exit)
PHASE E: Markdown
└─ New downtrend, strong selling
```
**Background Color:** Orange → Red (getting darker)
**Action:** Sell in Phase C/D, Stay out during Phase E
---
## 💰 VOLUME SPREAD ANALYSIS (VSA)
| Signal | Meaning | Color | Implication |
|--------|---------|-------|-------------|
| **ND** (No Demand) | Up bar, LOW volume | 🟠 Orange | Weakness - uptrend ending |
| **NS** (No Supply) | Down bar, LOW volume | 🔵 Blue | Strength - downtrend ending |
| **SV** (Stopping Volume) | VERY HIGH volume, narrow spread | 🟣 Purple | Potential reversal |
| **UT** (Upthrust) | Above resistance, LOW vol, weak close | 🔴 Red | Sell signal |
| **SO** (Shakeout) | Below support, HIGH vol, strong close | 🟢 Green | Buy signal |
---
## 🎯 VOLUME INTERPRETATION
| Volume Level | Bar Color | Meaning |
|--------------|-----------|---------|
| **VERY HIGH** (>2x average) | Dark Green/Red | Climax, potential reversal |
| **HIGH** (>1.5x average) | Light Green/Red | Strong interest |
| **NORMAL** | Gray | Average trading |
| **LOW** (<0.7x average) | Faint Gray | Testing, no interest |
---
## ⚖️ EFFORT vs RESULT
| Scenario | Volume | Spread | Meaning |
|----------|--------|--------|---------|
| **High Effort, Low Result** | HIGH | Narrow | ⚠️ Potential reversal |
| **Low Effort, High Result** | LOW | Wide | ⚠️ Trend weakening |
| **High Effort, High Result** | HIGH | Wide | ✅ Strong trend |
| **Low Effort, Low Result** | LOW | Narrow | 😴 No interest |
---
## 📏 TRADING RULES
### ✅ DO:
- ✅ Wait for confirmation before entering
- ✅ Trade in direction of higher timeframe
- ✅ Use springs and UTAD as primary signals
- ✅ Measure trading range for targets
- ✅ Place stops outside the range
- ✅ Look for volume confirmation
- ✅ Check multiple timeframes
- ✅ Focus on Phase C and D events
### ❌ DON'T:
- ❌ Buy during Phase E Markdown
- ❌ Sell during Phase E Markup
- ❌ Trade against major trend
- ❌ Ignore volume signals
- ❌ Enter without clear stop loss
- ❌ Trade every signal
- ❌ Use on very low timeframes without practice
- ❌ Ignore the context
---
## 🎪 COMPOSITE OPERATOR (Smart Money)
### 💰 Green Money Symbol (Bottom)
- **Meaning:** Institutions accumulating
- **Location:** Demand zones, springs, tests
- **Action:** Follow the smart money - buy
### 💰 Red Money Symbol (Top)
- **Meaning:** Institutions distributing
- **Location:** Supply zones, UTAD, weak rallies
- **Action:** Follow the smart money - sell
---
## 📍 SUPPLY & DEMAND ZONES
### 🟢 Demand Zones (Green Boxes)
- **Created at:** SC, Spring, Shakeout
- **Represents:** Where smart money bought
- **Action:** Look for bounces
### 🔴 Supply Zones (Red Boxes)
- **Created at:** BC, UTAD, Upthrust
- **Represents:** Where smart money sold
- **Action:** Look for rejections
---
## 🎯 TARGET CALCULATION
### Measured Move Method
```
1. Measure trading range height
Example: Top at 120, Bottom at 100 = 20 points
2. Add to breakout point (accumulation)
Breakout at 120 + 20 = Target: 140
3. Or subtract from breakdown (distribution)
Breakdown at 100 - 20 = Target: 80
```
### Multiple Targets
- **Conservative:** 1x range height (100% probability reached)
- **Moderate:** 1.5x range height (70% probability)
- **Aggressive:** 2x range height (40% probability)
---
## ⏰ TIMEFRAME GUIDE
| Timeframe | Use For | Reliability | Recommended For |
|-----------|---------|-------------|-----------------|
| **Weekly** | Major trends | ⭐⭐⭐⭐⭐ | Position traders |
| **Daily** | Swing trades | ⭐⭐⭐⭐⭐ | Most traders |
| **4-Hour** | Active swing | ⭐⭐⭐⭐ | Active traders |
| **1-Hour** | Day trading | ⭐⭐⭐ | Experienced only |
| **15-Min** | Scalping | ⭐⭐ | Experts only |
**Golden Rule:** Always check one timeframe higher for context!
---
## 🚨 ALERT PRIORITY
### 🔔 MUST-HAVE ALERTS
1. Spring
2. UTAD
3. SOS
4. SOW
### 🔔 NICE-TO-HAVE ALERTS
5. Selling Climax (SC)
6. Buying Climax (BC)
7. Smart Money Accumulation
8. Smart Money Distribution
### 🔔 CONFIRMATION ALERTS
9. Phase E Markup
10. Phase E Markdown
---
## 💡 QUICK DECISION TREE
```
Is there a clear trading range?
├─ YES
│ ├─ Did price break BELOW support?
│ │ ├─ Volume LOW + Quick reversal = SPRING → BUY ✅
│ │ └─ Volume HIGH + Stays down = Breakdown → SELL ⚠️
│ │
│ └─ Did price break ABOVE resistance?
│ ├─ Volume LOW + Quick reversal = UTAD → SELL ✅
│ └─ Volume HIGH + Stays up = Breakout → BUY ⚠️
│
└─ NO
├─ Strong uptrend = Wait for re-accumulation
└─ Strong downtrend = Wait for re-distribution
```
---
## 📝 PRE-TRADE CHECKLIST
Before entering any trade:
- Identified the current Wyckoff phase
- Confirmed with volume analysis
- Checked higher timeframe trend
- Located supply/demand zones
- Identified clear entry point
- Set stop loss level
- Calculated target (risk:reward >1:2)
- Verified position size (risk 1-2%)
- Have at least 2 confirming signals
- Not trading against major trend
---
## 🧠 REMEMBER
**The Three Laws:**
1. **Supply & Demand** - Price is determined by imbalance
2. **Cause & Effect** - Range size predicts move size
3. **Effort & Result** - Volume should confirm price movement
**The Key Principle:**
> "Trade with the Composite Operator (smart money), not against them"
**Best Setups:**
1. Spring in accumulation (Phase C)
2. UTAD in distribution (Phase C)
3. SOS breakout (Phase D)
4. SOW breakdown (Phase D)
**When in Doubt:**
- ❓ Stay out
- 📈 Use higher timeframe
- 📚 Review the documentation
- 🎯 Wait for clearer signal
---
## 📱 INDICATOR SETTINGS QUICK SETUP
**For Stocks/Crypto (Good Volume Data):**
- Volume MA Length: 20
- High Volume Multiplier: 1.5
- Climax Volume: 2.0
- Swing Length: 5
**For Forex (Limited Volume Data):**
- Volume MA Length: 20
- High Volume Multiplier: 1.3
- Climax Volume: 1.8
- Swing Length: 7
- Turn OFF "Volume Confirmation"
**For Day Trading:**
- Swing Length: 3
- All other settings: Default
**For Position Trading:**
- Swing Length: 7-10
- Volume MA Length: 30
- Use Daily/Weekly charts
---
## 🎓 SKILL PROGRESSION
### Beginner (Month 1-2)
- Focus on: SC, Spring, SOS
- Timeframe: Daily only
- Goal: Identify phases correctly
### Intermediate (Month 3-6)
- Add: All accumulation events
- Timeframe: Daily + 4H
- Goal: Trade springs profitably
### Advanced (Month 6-12)
- Add: Distribution events, VSA
- Timeframe: Multiple timeframes
- Goal: Trade complete cycles
### Expert (Year 2+)
- Master: All events, all timeframes
- Combine: With other methodologies
- Goal: Consistent profitability
---
**Print this sheet and keep it next to your trading desk!**
*Remember: Quality over quantity. Wait for the best setups.*
# Wyckoff Method - Comprehensive Analysis Indicator
## Complete Implementation Guide for TradingView Pine Script
---
## TABLE OF CONTENTS
1. (#overview)
2. (#installation)
3. (#theory)
4. (#components)
5. (#signals)
6. (#strategies)
7. (#settings)
8. (#alerts)
9. (#patterns)
10. (#troubleshooting)
---
## OVERVIEW
This indicator implements Richard Wyckoff's complete trading methodology, including:
- **All 5 Phases** of Accumulation and Distribution
- **18+ Wyckoff Events** (PS, SC, AR, ST, Spring, SOS, LPS, BC, UTAD, SOW, etc.)
- **Volume Spread Analysis (VSA)** principles
- **Supply & Demand Zone** detection
- **Composite Operator** logic (Smart Money tracking)
- **Effort vs Result** analysis
- **Three Wyckoff Laws**: Supply/Demand, Cause/Effect, Effort/Result
---
## INSTALLATION
### Step 1: Copy the Code
1. Open the `wyckoff_comprehensive.pine` file
2. Select all code (Ctrl+A / Cmd+A)
3. Copy to clipboard (Ctrl+C / Cmd+C)
### Step 2: Add to TradingView
1. Go to TradingView.com
2. Open any chart
3. Click "Pine Editor" at the bottom of the screen
4. Click "New" or "Open"
5. Paste the entire code
6. Click "Save" and give it a name
7. Click "Add to Chart"
### Step 3: Verify Installation
You should see:
- Labels on the chart (PS, SC, Spring, SOS, etc.)
- Background colors indicating phases
- Volume analysis in the lower pane
- A table in the top-right corner showing current phase
---
## WYCKOFF METHOD THEORY
### The Three Fundamental Laws
#### 1. **Law of Supply and Demand**
- Price rises when demand exceeds supply
- Price falls when supply exceeds demand
- The indicator tracks volume vs price movement to identify imbalances
#### 2. **Law of Cause and Effect**
- A period of accumulation (cause) leads to markup (effect)
- A period of distribution (cause) leads to markdown (effect)
- Trading ranges build "cause" for future price movement
#### 3. **Law of Effort vs Result**
- **Effort** = Volume (energy put into the market)
- **Result** = Price movement (spread of the bar)
- High effort with low result = potential reversal
- Low effort with high result = trend weakness
### The Five Phases
#### **ACCUMULATION CYCLE**
**Phase A: Stopping the Downtrend**
- Preliminary Support (PS): First sign of buying
- Selling Climax (SC): Panic selling exhaustion
- Automatic Rally (AR): Bounce from SC
- Secondary Test (ST): Test of SC low on lower volume
**Phase B: Building the Cause**
- Trading range develops
- Supply being absorbed by composite operator
- Multiple tests of support and resistance
- Volume generally decreases
**Phase C: The Test (Spring)**
- False breakdown below support
- Traps late sellers
- Quick reversal on low volume
- Last chance to accumulate before markup
**Phase D: Dominance Emerges**
- Sign of Strength (SOS): Break above resistance
- Last Point of Support (LPS): Pullback opportunity
- Backup (BU): Final consolidation
- Demand clearly exceeds supply
**Phase E: Markup**
- New uptrend established
- Price moves rapidly higher
- Phase E can last months/years
- Original trading range becomes support
#### **DISTRIBUTION CYCLE**
**Phase A: Stopping the Uptrend**
- Preliminary Supply (PSY): First sign of selling
- Buying Climax (BC): Euphoric buying exhaustion
- Automatic Reaction (AR): Sharp selloff from BC
- Secondary Test (ST): Test of BC high on lower volume
**Phase B: Building the Cause**
- Trading range at top
- Demand being absorbed by composite operator
- Multiple tests of support and resistance
**Phase C: The Test (UTAD)**
- Upthrust After Distribution
- False breakout above resistance
- Traps late buyers
- Quick reversal
**Phase D: Dominance Emerges**
- Sign of Weakness (SOW): Break below support
- Last Point of Supply (LPSY): Rally opportunity to exit
- Supply clearly exceeds demand
**Phase E: Markdown**
- New downtrend established
- Price moves rapidly lower
- Original trading range becomes resistance
---
## INDICATOR COMPONENTS
### 1. EVENT LABELS
#### Accumulation Events (Green labels)
- **PS** = Preliminary Support
- **SC** = Selling Climax (largest label, most important)
- **AR** = Automatic Rally
- **ST** = Secondary Test
- **SPRING** = Spring (critical buy signal)
- **TEST** = Test of support
- **SOS** = Sign of Strength (breakout)
- **LPS** = Last Point of Support
- **BU** = Backup
#### Distribution Events (Red labels)
- **PSY** = Preliminary Supply
- **BC** = Buying Climax (largest label, most important)
- **AR** = Automatic Reaction
- **ST** = Secondary Test
- **UTAD** = Upthrust After Distribution (critical sell signal)
- **SOW** = Sign of Weakness
- **LPSY** = Last Point of Supply
#### VSA Events (Small colored labels)
- **ND** (Orange) = No Demand - weakness
- **NS** (Blue) = No Supply - strength
- **SV** (Purple) = Stopping Volume
- **UT** (Red) = Upthrust - weakness
- **SO** (Green) = Shakeout - strength
#### Composite Operator (💰 symbols)
- Green 💰 at bottom = Smart Money Accumulation
- Red 💰 at top = Smart Money Distribution
### 2. BACKGROUND COLORS
- **Light Blue** = Phase A (Accumulation)
- **Light Orange** = Phase A (Distribution)
- **Very Light Green** = Phase C (Accumulation Testing)
- **Very Light Red** = Phase C (Distribution Testing)
- **Light Green** = Phase D (Accumulation Strength)
- **Light Red** = Phase D (Distribution Weakness)
- **Green** = Phase E (Markup - Bull trend)
- **Red** = Phase E (Markdown - Bear trend)
### 3. SUPPLY & DEMAND ZONES
- **Green boxes** = Demand zones (where smart money accumulated)
- **Red boxes** = Supply zones (where smart money distributed)
- Zones extend 20 bars into the future
- Price reactions at these zones are significant
### 4. VOLUME PANEL
- **Dark Green/Red bars** = Very High Volume (climax)
- **Light Green/Red bars** = High Volume
- **Gray bars** = Normal Volume
- **Faint Gray bars** = Low Volume
- **Blue line** = Volume Moving Average
### 5. INFORMATION TABLE (Top Right)
Displays real-time analysis:
- **Current Phase** (A, B, C, D, or E)
- **Status** (description of what's happening)
- **Volume** (Very High, High, Normal, Low)
- **Spread** (Wide, Normal, Narrow)
- **Effort/Result** (Poor, Normal, Good)
- **Range** (YES if in trading range)
- **Bias** (BULLISH, BEARISH, or NEUTRAL)
---
## HOW TO READ THE SIGNALS
### STRONG BUY SIGNALS (in order of strength)
1. **SPRING** (strongest)
- False breakdown below support
- Look for: Low volume, quick reversal, close above support
- Entry: When price closes back above support level
- Stop: Below the spring low
2. **SOS (Sign of Strength)**
- Break above trading range resistance
- Look for: High volume, wide spread up bar
- Entry: On breakout or pullback to LPS
- Stop: Below trading range
3. **Shakeout (SO)**
- Similar to spring but more violent
- Look for: High volume, penetration of support, strong close
- Entry: When price reclaims support
- Stop: Below shakeout low
4. **LPS (Last Point of Support)**
- Pullback after SOS
- Look for: Low volume, shallow pullback
- Entry: When support holds
- Stop: Below LPS
5. **No Supply (NS)**
- Down bar on very low volume
- Indicates lack of selling pressure
- Confirms accumulation phase
### STRONG SELL SIGNALS (in order of strength)
1. **UTAD (Upthrust After Distribution)** (strongest)
- False breakout above resistance
- Look for: High volume spike, rejection, close below resistance
- Entry: When price closes back below resistance
- Stop: Above UTAD high
2. **SOW (Sign of Weakness)**
- Break below trading range support
- Look for: High volume, wide spread down bar
- Entry: On breakdown or rally to LPSY
- Stop: Above trading range
3. **Upthrust (UT)**
- Move above resistance on low volume, weak close
- Look for: Low volume, close in lower half of bar
- Entry: When resistance becomes resistance again
- Stop: Above upthrust high
4. **LPSY (Last Point of Supply)**
- Rally after SOW
- Look for: Low volume, weak rally
- Entry: When rally fails
- Stop: Above LPSY
5. **No Demand (ND)**
- Up bar on very low volume
- Indicates lack of buying pressure
- Confirms distribution phase
### NEUTRAL/WARNING SIGNALS
- **High Effort, Low Result** = Potential reversal coming
- **Stopping Volume** = Trend may be ending
- **Absorption** = Large volume with small movement (accumulation/distribution)
---
## TRADING STRATEGY EXAMPLES
### Strategy 1: Accumulation Range Breakout
**Setup:**
1. Identify trading range (blue background in Phase B)
2. Wait for Spring or Test (Phase C)
3. Wait for SOS breakout (Phase D)
**Entry:**
- Option A: Buy on SOS breakout
- Option B: Wait for LPS pullback (better risk/reward)
**Stop Loss:**
- Below the spring low or trading range bottom
**Target:**
- Measure height of trading range (cause)
- Project upward from breakout point (effect)
- Minimum target = range height
**Example:**
```
Trading Range: 100 to 120 (20 point range)
SOS Breakout at: 120
Target: 120 + 20 = 140 minimum
```
### Strategy 2: Distribution Range Breakdown
**Setup:**
1. Identify trading range after uptrend
2. Wait for UTAD (Phase C)
3. Wait for SOW breakdown (Phase D)
**Entry:**
- Option A: Sell on SOW breakdown
- Option B: Wait for LPSY rally (better risk/reward)
**Stop Loss:**
- Above the UTAD high or trading range top
**Target:**
- Measure height of trading range
- Project downward from breakdown point
- Minimum target = range height
### Strategy 3: Spring Trading
**Setup:**
1. Strong downtrend followed by range
2. Price breaks below range bottom
3. Volume is LOW on breakdown
4. Price quickly reverses and closes above support
**Entry:**
- When candle closes above support level
- Or on retest of support
**Stop Loss:**
- Below spring low (usually tight)
**Target:**
- Top of trading range
- Previous swing high
**Risk/Reward:**
- Typically 1:3 or better
### Strategy 4: Smart Money Tracking
**Setup:**
1. Look for 💰 symbols in demand zones
2. Multiple accumulation signals (PS, SC, ST, Test)
3. Volume decreasing during range
**Entry:**
- At next demand zone test
- On SOS breakout
**Confirmation:**
- Background turning green (Phase D/E)
- Table shows "BULLISH" bias
### Strategy 5: VSA Reversal
**Setup:**
1. Strong trend in place
2. Stopping Volume (SV) appears at extreme
3. Followed by No Demand (ND) or No Supply (NS)
**Entry:**
- When trend breaks down/up
- On retest of extreme
**Example (Bullish):**
```
Downtrend → Stopping Volume → No Supply → Up bar
Entry: Buy when price moves above SV bar
```
---
## SETTINGS & CUSTOMIZATION
### Volume Analysis Settings
**Volume MA Length** (default: 20)
- Shorter = More sensitive to volume changes
- Longer = Smoother, less noise
- Recommended: 15-25 for most timeframes
**High Volume Multiplier** (default: 1.5)
- Threshold for "high volume"
- Lower = More signals
- Higher = Only extreme volume
- Recommended: 1.3-2.0
**Climax Volume Multiplier** (default: 2.0)
- Threshold for climax events (SC, BC)
- Should be significantly higher than normal
- Recommended: 2.0-3.0
### Phase Detection Settings
**Swing Detection Length** (default: 5)
- How many bars to look left/right for swing points
- Shorter = More swings detected (more noise)
- Longer = Fewer swings (cleaner, might miss some)
- Recommended: 3-7
**Range Expansion Threshold** (default: 1.5)
- Multiplier for "wide spread" bars
- Higher = Only very wide bars qualify
- Recommended: 1.3-2.0
**Volume Confirmation** (default: ON)
- Requires volume confirmation for events
- Turn OFF for very low volume instruments
- Keep ON for stocks, forex, crypto
### Display Options
Toggle on/off:
- ✅ **Show Accumulation/Distribution Phases** - Background colors
- ✅ **Show Wyckoff Events** - All labeled events
- ✅ **Show Volume Spread Analysis** - VSA labels
- ✅ **Show Supply/Demand Zones** - Boxes on chart
- ✅ **Show Composite Operator Signals** - 💰 symbols
### Color Customization
- **Bullish Color** - All accumulation events
- **Bearish Color** - All distribution events
- **Neutral Color** - Range/neutral signals
---
## ALERT SETUP
### Available Alerts
1. **Selling Climax (SC)** - Potential bottom forming
2. **Spring** - Strong buy signal
3. **Sign of Strength (SOS)** - Bullish breakout
4. **Buying Climax (BC)** - Potential top forming
5. **UTAD** - Strong sell signal
6. **Sign of Weakness (SOW)** - Bearish breakdown
7. **Phase E Markup** - Uptrend confirmed
8. **Phase E Markdown** - Downtrend confirmed
9. **Smart Money Accumulation** - Institutions buying
10. **Smart Money Distribution** - Institutions selling
### How to Set Up Alerts
1. Click the "⏰" icon on TradingView
2. Select "Create Alert"
3. Condition: Choose the indicator and alert type
4. Example: "Wyckoff Method - Spring"
5. Set notification preferences (popup, email, webhook)
6. Click "Create"
### Recommended Alert Strategy
**Conservative Trader:**
- Spring
- SOS
- UTAD
- SOW
**Aggressive Trader:**
- Add: SC, BC, Smart Money signals
**Long-term Investor:**
- Phase E Markup
- Phase E Markdown
- Smart Money Accumulation
---
## COMMON PATTERNS
### Pattern 1: Classic Accumulation
```
Phase A: Downtrend → PS → SC → AR → ST
Phase B: Range building (4-12 weeks typical)
Phase C: Spring (false breakdown)
Phase D: SOS → LPS → BU
Phase E: Markup (new uptrend)
```
**What to do:**
- Mark the range boundaries
- Wait for spring
- Buy on LPS or SOS
- Hold through markup
### Pattern 2: Classic Distribution
```
Phase A: Uptrend → PSY → BC → AR → ST
Phase B: Range building (topping process)
Phase C: UTAD (false breakout)
Phase D: SOW → LPSY
Phase E: Markdown (new downtrend)
```
**What to do:**
- Mark the range boundaries
- Wait for UTAD
- Sell on LPSY or SOW
- Stay out during markdown
### Pattern 3: Re-Accumulation
```
Uptrend → Trading Range → Spring → Uptrend continues
```
- Occurs during existing uptrend
- Shorter accumulation period
- Often no clear SC (trend is already up)
- Spring is the key signal
### Pattern 4: Re-Distribution
```
Downtrend → Trading Range → UTAD → Downtrend continues
```
- Occurs during existing downtrend
- Shorter distribution period
- Often no clear BC (trend is already down)
- UTAD is the key signal
### Pattern 5: Failed Breakout
**Bullish Failed Breakout:**
```
Range → Breakdown → Immediate reversal (Spring)
```
- Price breaks support
- Volume is LOW
- Immediate strong reversal
- Very bullish
**Bearish Failed Breakout:**
```
Range → Breakout → Immediate reversal (UTAD)
```
- Price breaks resistance
- Volume may be high initially
- Quick rejection and reversal
- Very bearish
---
## TIMEFRAME RECOMMENDATIONS
### Daily Charts (Most Reliable)
- Best for swing trading
- Clear phases and events
- Less noise
- Recommended for beginners
### 4-Hour Charts
- Good for active swing traders
- Faster signals than daily
- Still reliable
### 1-Hour Charts
- For day traders
- More false signals
- Need to filter carefully
- Use in conjunction with higher timeframe
### 15-Minute / 5-Minute
- Only for experienced traders
- High noise level
- Many false signals
- Use daily chart for context
**Golden Rule:** Always check higher timeframe first!
---
## MULTI-TIMEFRAME ANALYSIS
### Top-Down Approach (Recommended)
1. **Weekly Chart** - Identify major trend and phase
2. **Daily Chart** - Find current accumulation/distribution
3. **4H Chart** - Identify entry timing
4. **Entry Timeframe** - Execute trade
### Example Analysis:
**Weekly:** Phase E Markup (bullish)
**Daily:** Phase B Re-accumulation
**4-Hour:** Spring detected
**Action:** Buy on daily LPS
---
## WYCKOFF + OTHER INDICATORS
### Complementary Tools
1. **Moving Averages**
- 20/50 SMA for trend context
- Already plotted on indicator
2. **RSI**
- Divergences at SC/BC
- Confirms overbought/oversold
3. **MACD**
- Confirms trend change in Phase D
- Divergences support Wyckoff events
4. **Volume Profile**
- Identifies value areas
- Confirms supply/demand zones
5. **Order Flow / Footprint Charts**
- See institutional activity
- Confirms smart money signals
**Don't Over-Complicate:**
- Wyckoff is a complete system
- Other indicators are supplementary
- When in doubt, trust Wyckoff
---
## TROUBLESHOOTING
### Issue: Too Many Labels
**Solution:**
- Increase swing length (Settings → 7 or 10)
- Increase volume multipliers
- Turn off VSA labels if not needed
- Focus on major events only (SC, Spring, SOS, BC, UTAD, SOW)
### Issue: Missing Expected Events
**Solution:**
- Decrease swing length (Settings → 3)
- Decrease volume multipliers
- Turn OFF volume confirmation
- Check timeframe (use daily chart)
### Issue: False Signals
**Solution:**
- Use higher timeframe
- Wait for confirmation
- Don't trade against major trend
- Look for multiple signal convergence
### Issue: Can't See Background Colors
**Solution:**
- Check "Show Phases" is enabled
- Increase monitor brightness
- Colors are subtle by design (not to obscure price)
### Issue: Volume Shows Incorrectly
**Solution:**
- Ensure volume data is available for your symbol
- Some symbols have poor volume data
- Forex spot pairs have no real volume
- Use futures or stock markets for best results
### Issue: No Trading Range Detected
**Solution:**
- Market may be trending strongly
- Trading range might be too small
- Wait for price to consolidate
- Not all markets have clear ranges
---
## ADVANCED TIPS
### 1. Count Point & Figure Charts
- Wyckoff used P&F to measure "cause"
- Width of range × height = minimum move target
- Longer accumulation = larger markup
### 2. Watch for Absorption
- High volume + narrow spread = someone absorbing
- In downtrend = accumulation
- In uptrend = distribution
### 3. Multiple Timeframe Springs
- Spring on daily + spring on weekly = very strong
- Increases probability significantly
### 4. Failed Signals Are Signals Too
- Failed spring = weakness, expect lower
- Failed UTAD = strength, expect higher
### 5. Context is King
- Don't buy during Phase E Markdown
- Don't sell during Phase E Markup
- Respect the major trend
### 6. Volume Precedes Price
- Study volume changes first
- Price follows volume
- Decreasing volume in range = building energy
### 7. Composite Operator Mindset
- Think like institutions
- Where would smart money buy/sell?
- They need liquidity (retail traders)
---
## RISK MANAGEMENT
### Position Sizing
**Conservative:**
- Risk 1% per trade
- Wider stops at range boundaries
**Moderate:**
- Risk 1-2% per trade
- Stops below spring/above UTAD
**Aggressive:**
- Risk 2-3% per trade
- Tight stops
- Higher win rate needed
### Stop Loss Placement
**Accumulation:**
- Below spring low
- Below trading range bottom
- Below demand zone
**Distribution:**
- Above UTAD high
- Above trading range top
- Above supply zone
### Take Profit Strategy
**Method 1: Measured Move**
- Range height = minimum target
- 2x range height = extended target
**Method 2: Fibonacci Extensions**
- 1.0 = range height
- 1.618 = extended target
- 2.618 = maximum target
**Method 3: Trail the Stop**
- Move stop to breakeven at 1R
- Trail under swing lows in markup
- Lock in profits progressively
---
## BACKTESTING CHECKLIST
Before trading with real money:
- Backtest on 50+ historical examples
- Record all signals in trading journal
- Calculate win rate (aim for >50%)
- Calculate average R:R (aim for >1:2)
- Test on multiple instruments
- Test on multiple timeframes
- Test in different market conditions
- Verify signal consistency
- Practice on demo account
- Start small with real money
---
## RECOMMENDED READING
### Books
1. **"Studies in Tape Reading"** - Richard D. Wyckoff
2. **"The Richard D. Wyckoff Method"** - Rubén Villahermosa
3. **"Charting the Stock Market: The Wyckoff Method"** - Jack Hutson
4. **"Master the Markets"** - Tom Williams (VSA)
### Courses
1. Wyckoff Analytics - Official Wyckoff course
2. TradeVSA - Volume Spread Analysis
3. StockCharts - Wyckoff education
### Communities
1. Wyckoff Analytics Forum
2. Reddit r/Wyckoff
3. TradingView Wyckoff ideas section
---
## FREQUENTLY ASKED QUESTIONS
**Q: Can I use this on crypto?**
A: Yes, works well on major cryptocurrencies with good volume.
**Q: Does it work on forex?**
A: Yes, but use futures volume (like 6E for EUR/USD) for better accuracy.
**Q: What's the best timeframe?**
A: Daily chart for most traders. 4H for more active trading.
**Q: How long does accumulation last?**
A: Typically 2-12 weeks. Longer accumulation = bigger markup.
**Q: Can I automate this?**
A: You can use the alerts, but manual analysis is recommended.
**Q: What's the win rate?**
A: With proper filtering: 60-70% on major signals (Spring, UTAD, SOS, SOW).
**Q: Should I trade every signal?**
A: No. Focus on Spring, UTAD, SOS, and SOW in trending markets.
**Q: What if I see conflicting signals?**
A: Use higher timeframe for context. When in doubt, stay out.
**Q: How do I know which phase I'm in?**
A: Check the table in top-right corner. Also look at background color.
**Q: Can I use this for options trading?**
A: Yes, excellent for timing option entries (especially around Spring/UTAD).
---
## FINAL THOUGHTS
The Wyckoff Method is:
- **A complete trading system** (not just an indicator)
- **Based on 100+ years** of market wisdom
- **Used by institutions** and professional traders
- **Requires practice** and screen time
- **Highly effective** when applied correctly
**Success Tips:**
1. Start with daily charts
2. Focus on major events (SC, Spring, SOS, BC, UTAD, SOW)
3. Always check higher timeframe context
4. Wait for confirmation before entering
5. Manage risk properly
6. Keep a trading journal
7. Be patient - wait for the best setups
**Remember:**
- Not every range will have all events
- Some phases may be abbreviated
- Context and confluence matter most
- Practice makes perfect
---
## SUPPORT & UPDATES
For questions, improvements, or bug reports:
- Check TradingView script comments
- Join Wyckoff trading communities
- Study historical examples
- Practice on demo accounts
**Good luck and happy trading!**
---
*Disclaimer: This indicator is for educational purposes. Always do your own analysis and risk management. Past performance does not guarantee future results.*
# WYCKOFF VISUAL SETUP EXAMPLES
## ACCUMULATION SCHEMATIC #1 (Classic Bottom)
```
Price Chart View:
│ PHASE E
│ MARKUP
│ ╱
│ ╱
┌─SOS─────┤ ╱
│ │ ╱
┌───────────┤ ┌LPS │╱
│ PHASE B │ │ │
│ (Cause) └──┴──────┤
┌AR──┤ │
┌────┤ │ ┌─Spring │ PHASE D
│ └ST──┤ │ │
│ │ │ │
────SC────────┴─────────┴───────────┴──────────
│
PS
│ PHASE A
│
Downtrend
```
### PHASE A - Stopping the Downtrend
```
PS: │ High volume down bar
▼ First sign of support
■ Not bottom yet
SC: │ VERY HIGH volume
▼ Panic selling exhaustion
█ Long lower wick
█ This is the low
AR: │ Automatic rally
▲ Relief bounce
■ High volume acceptable
ST: │ Secondary test
▼ Low volume (KEY!)
■ Tests SC low
```
### PHASE B - Building the Cause
```
┌─────────┐
│ ~~~ │ Multiple tests
│ ~ ~ │ Volume decreases
│~ ~ │ Range gets tighter
└─────────┘
Duration: 2-12 weeks typical
The longer, the bigger the eventual move
```
### PHASE C - The Test (SPRING)
```
║ False breakdown
─────╨─────
▼ Low volume
█ Breaks below support
■
█ Quick reversal
▲ Closes ABOVE support
CRITICAL: Volume must be LOW
Close must be strong
Happens quickly (1-3 bars)
```
### PHASE D - Strength Emerges
```
SOS: ▲ Sign of Strength
────╥──── Break above resistance
║ High volume
║ Wide spread
LPS: ▼ Last Point Support
■ Pullback on LOW volume
▲ Great entry point
BU: ▲ Backup
■ Final consolidation
▲ Before markup
```
### PHASE E - Markup
```
╱
╱
╱ Strong uptrend
╱ High momentum
╱ Can last months/years
──╱──
```
---
## DISTRIBUTION SCHEMATIC #2 (Classic Top)
```
Price Chart View:
Uptrend
│
PSY
│ PHASE A
────BC────────┬─────────┬───────────┬──────────
│ │ UTAD │
│ PHASE B │ │ PHASE D
┌AR──┤ ┌LPSY │ │
│ │ │ └───────────┤
│ └──┴──────┐ │╲
└ST──┤ │ │ ╲
│ └───────────┤ ╲
└─SOW─────┤ │ ╲
│ │ ╲
│ PHASE C │ ╲
│ │ PHASE E
│ │ MARKDOWN
```
### PHASE A - Stopping the Uptrend
```
PSY: │ High volume up bar
▲ Preliminary supply
■ Selling starting
BC: │ VERY HIGH volume
▲ Buying climax
█ Euphoric top
█ Long upper wick
AR: │ Automatic reaction
▼ Sharp selloff
■ High volume
ST: │ Secondary test
▲ Low volume (KEY!)
■ Tests BC high
```
### PHASE C - The Test (UTAD)
```
▲ False breakout
────╥────
║ Breaks ABOVE resistance
║ Often high volume spike
▼
█ Rejection / weak close
█ Closes BELOW resistance
▼
CRITICAL: Closes weak
Quick rejection
Traps buyers
```
### PHASE D - Weakness Emerges
```
SOW: ▼ Sign of Weakness
────╨──── Break below support
║ High volume
║ Wide spread
LPSY: ▲ Last Point Supply
■ Rally on LOW volume
▼ Last chance to exit
```
---
## VOLUME PATTERNS (Critical to Understanding)
### ACCUMULATION Volume Pattern
```
Volume
│ SC
█
█ ST
■ ■ Spring
■ ■ ■ SOS LPS
──┴────┴────┴──────█───■────►
│ │ │ │ │
│ │ │ │ │
A A C D D
Pattern: HIGH → low → low → HIGH → low
Key: Volume DECREASES during range
INCREASES on breakout
```
### DISTRIBUTION Volume Pattern
```
Volume
│ BC
█
█ ST
■ ■ UTAD
■ ■ ■ SOW LPSY
──┴────┴────┴──────█───■────►
│ │ │ │ │
│ │ │ │ │
A A C D D
Pattern: HIGH → low → varies → HIGH → low
Key: Volume MAY increase on UTAD
Definitely HIGH on breakdown (SOW)
```
---
## REAL TRADE SETUPS
### Setup #1: SPRING BUY
```
Entry Conditions:
1. Clear trading range identified
2. Price breaks BELOW support
3. Volume is LOW (critical!)
4. Price reverses QUICKLY
5. Closes ABOVE support level
Entry: Next bar or on retest
Stop: Below spring low
Target: Top of range (minimum)
Example:
Support: $100
Spring low: $98 (low volume)
Close: $101
Entry: $102
Stop: $97.50
Target: $120 (range top)
Risk/Reward: 1:4
```
### Setup #2: UTAD SELL
```
Entry Conditions:
1. Clear trading range identified (after uptrend)
2. Price breaks ABOVE resistance
3. Often high volume spike
4. Price reverses QUICKLY
5. Closes BELOW resistance level
Entry: Next bar or on retest
Stop: Above UTAD high
Target: Bottom of range (minimum)
Example:
Resistance: $200
UTAD high: $205 (spike)
Close: $198
Entry: $197
Stop: $206
Target: $180 (range bottom)
Risk/Reward: 1:2
```
### Setup #3: SOS BREAKOUT
```
Entry Conditions:
1. Clear accumulation range
2. Spring already occurred (ideal)
3. Price breaks ABOVE resistance
4. HIGH volume on breakout
5. Wide spread up bar
Entry Option A: On breakout ($120)
Entry Option B: Wait for LPS pullback ($115)
Stop: Below range or LPS
Target: Range height projected up
Example:
Range: $100-$120 (20 points)
SOS breakout: $120
Entry A: $120
Stop: $115
Target 1: $140 (100%)
Target 2: $150 (150%)
```
---
## VSA SPECIFIC PATTERNS
### Pattern 1: No Demand (Weakness)
```
▲
■ Up bar
■ Low volume ◄── KEY
▲ Small body
Context: After uptrend
Meaning: Buyers exhausted
Action: Prepare to sell
```
### Pattern 2: No Supply (Strength)
```
▼
■ Down bar
■ Low volume ◄── KEY
▼ Small body
Context: After downtrend
Meaning: Sellers exhausted
Action: Prepare to buy
```
### Pattern 3: Stopping Volume
```
═ Very high volume
█ Narrow spread ◄── KEY
═ Price not moving
Context: At extremes
Meaning: Absorption
Action: Expect reversal
```
---
## COMMON MISTAKES (What NOT to Do)
### ❌ Mistake 1: Buying Prematurely
```
WRONG:
SC
▼
█ ← DON'T BUY HERE
CORRECT:
Spring
─────╨─────
▼
█ ← BUY HERE
▲
```
### ❌ Mistake 2: Ignoring Volume
```
WRONG: "It broke below support, must be spring"
─────╨───── High volume
█
This is a BREAKDOWN, not a spring!
CORRECT Spring:
─────╨───── LOW volume ✓
■ Quick reversal ✓
▲
```
### ❌ Mistake 3: Trading Against Trend
```
WRONG:
Markdown Phase E
╲
╲ ← Trying to buy here
╲
╲
CORRECT:
Wait for new accumulation to complete
```
---
## MULTI-TIMEFRAME EXAMPLE
### Weekly Chart: Phase E Markup (Bullish)
```
╱
╱
╱ Long-term uptrend
╱
───╱─────
```
### Daily Chart: Re-Accumulation Phase C
```
┌─────────┐
│ Spring │ ← We are here
│ ▼ │
─────┴────█────┴─────
▲
```
### 4-Hour Chart: Entry Timing
```
Last 48 hours:
─────╨───── Spring occurred
█
▲ ← Enter now
■
```
**Result:** Triple confirmation across timeframes = High probability trade
---
## PROFIT TARGETS (Visual Guide)
### Method 1: Basic Measured Move
```
Resistance: 120 ┐ ─────────
│
│ 20 points
│
Support: 100 ┘ ─────────
Breakout: 120
Target: 120 + 20 = 140
╱╱╱ 140 (Target)
╱╱╱
╱╱╱
──────◄ 120 (Breakout)
│
Range │ 20
│
──────┘ 100
```
### Method 2: Multiple Targets
```
╱╱╱ 150 (Target 3: 2.5x) - 20% position
╱╱╱
╱╱╱ 140 (Target 2: 2x) - 30% position
╱╱╱
─────◄╱ 130 (Target 1: 1x) - 50% position
│
10 │ 120 (Breakout)
│
─────┘ 110 (Support)
```
### Method 3: Trailing Stop
```
1. Move stop to breakeven at Target 1
2. Trail stop under swing lows
3. Let winners run
╱╱╱
╱ ╱╱ ← Trail stop here
╱╱ ╱
╱ ╱ ← Then here
─────◄──╱
← Start here (breakeven)
```
---
## TIMING ENTRIES (Exact Bar Patterns)
### Perfect Spring Entry
```
Bar 1: ▼ Breaks below (Low vol)
█
Bar 2: ▲ Reverses (Closes strong)
█ ◄─ ENTER HERE
Bar 3: ■ Confirms
▲
DON'T WAIT for Bar 3!
Enter on Bar 2 close
```
### Perfect UTAD Entry
```
Bar 1: ▲ Breaks above (Spike vol OK)
█
Bar 2: ▼ Reverses (Closes weak)
█ ◄─ ENTER HERE
Bar 3: ■ Confirms
▼
SHORT on Bar 2 close
Don't wait for more confirmation
```
---
## COMPOSITE OPERATOR PSYCHOLOGY
### What Smart Money Does (Follow Them)
**Accumulation:**
```
1. Create fear (PS, SC)
2. Shake out weak hands (Spring)
3. Absorb supply quietly (Phase B)
4. Test for remaining supply (Test)
5. Mark it up (SOS → Phase E)
💰 They buy LOW when retail panics
```
**Distribution:**
```
1. Create euphoria (PSY, BC)
2. Trap late buyers (UTAD)
3. Distribute to buyers (Phase B)
4. Test for remaining demand (ST)
5. Mark it down (SOW → Phase E)
💰 They sell HIGH when retail buys
```
### Where to Look for Smart Money
```
💰 Buy signals appear at:
- Demand zones (green boxes)
- Springs and shakeouts
- Tests of support
- After selling climax
💰 Sell signals appear at:
- Supply zones (red boxes)
- UTAD and upthrusts
- Weak rallies (LPSY)
- After buying climax
```
---
## PRACTICE EXERCISES
### Exercise 1: Identify the Phase
Look at any chart and ask:
1. Is there a trading range? (Phase B likely)
2. Did we just stop a trend? (Phase A)
3. Was there a spring/UTAD? (Phase C)
4. Is there a breakout? (Phase D)
5. Is trend running? (Phase E)
### Exercise 2: Volume Analysis
For each bar, note:
- Volume level (High/Normal/Low)
- Spread (Wide/Normal/Narrow)
- Effort vs Result (Matching? Diverging?)
### Exercise 3: Find Historical Springs
Go back 6 months:
- Mark all springs you can find
- Note the setup before each
- Track what happened after
- Calculate win rate
---
## FINAL VISUALIZATION: The Complete Cycle
```
ACCUMULATION → MARKUP → DISTRIBUTION → MARKDOWN → ACCUMULATION...
Distribution Accumulation
(Top) (Bottom)
┌───────────────┐ ┌───────────────┐
│ BC UTAD │ │ Spring SC │
│ │ │ │ │ │ │ │
────┴───┴───┴───────┴─╲ ╱────────┴───┴───┴────
╲ ╱
Markdown ╲ ╱ Markup
(Phase E) ╲ ╱ (Phase E)
╲ ╱
╲ ╱
╲ ╱
╲ ╱
V
The market cycles endlessly
Your job: Identify where you are in the cycle
Trade accordingly
```
---
**Remember:**
- 📊 Study charts daily
- 📝 Journal every setup
- 🎯 Wait for the best signals
- 💰 Follow smart money
- ⏰ Be patient
- 🚀 Let winners run
**The indicator does the heavy lifting - you make the decisions!**

Opening Range & Session Liquidity [LTS]“Opening Range & Session Liquidity ” is an intraday planning tool that combines a configurable Opening Range box with session highs/lows and previous-day reference levels. It is designed to help you visualize where liquidity is likely to build up around the cash open and major global sessions, without making any forecasts or performance promises. It is designed with our signature attention to user customization and accessibility.
Opening Range & Bias
The script builds a configurable Opening Range (OR) in New York time (default 08:00–08:15 on a 15-minute basis), regardless of your chart timeframe (up to 1-hour). The high, low, and midline of this window are drawn as a transparent box and dashed midline that extend forward so you can see how the session trades around that range.
At a user-defined Bias Check Time (default 09:30–09:31 NY), the script classifies the OR as:
Bullish if price is above the OR high
Bearish if price is below the OR low
Neutral if price is still trading inside the OR
The box color updates to reflect the current bias if bias mode is enabled. All OR parameters (formation window, bias check, colors, maximum number of zones, etc.) are adjustable.
Entry Signal Logic
The indicator can optionally generate non-repainting visual signals when price interacts with the OR midline.
1. 9:30 Bias mode (trend-following)
A directional bias is locked in at the bias check time.
Signals trigger only when price trades through the OR midline inside the box, aligned with that bias:
Bullish bias → long signal when price touches the midline from below and closes inside the range.
Bearish bias → short signal when price touches the midline from above and closes inside the range.
Each “episode” can fire only once; signals are confirmed on the bar where the conditions first become true.
2. Entry Direction mode (reaction to first touch)
Instead of using a fixed 9:30 bias, the script detects from which side price first enters the OR (from above or from below).
That “entry direction” stays active until price fully exits and closes outside the OR again.
When price later touches the midline while the entry direction is defined, a single long or short signal is triggered based on the stored direction of entry.
In both modes, historical signals are plotted without using future data; only the real-time bar can change state until it closes.
Optional TP/SL Visualization
When a long or short signal appears, the script can draw simple take-profit/stop-loss boxes to illustrate a basic one-trade idea:
Stop-loss distance can be defined as:
A fixed number of points beyond the OR high/low, or
A percentage of ATR (configurable length and percent).
Take-profit is automatically placed at a user-defined risk-to-reward multiple of that stop distance.
The boxes extend forward bar by bar and stop updating once either TP or SL is touched, or when a new OR session resets the context.
These boxes are for visualization only and do not place or manage orders.
Session Liquidity & PDH/PDL
To help you map where liquidity frequently builds up, the script tracks three configurable intraday sessions in New York time:
Asian session (default 18:00–02:00)
London session (default 03:00–08:00)
New York session (default 09:30–16:00)
For each completed session, the indicator records the session high and low, then:
Draws solid horizontal lines and labels (e.g., “Asia Hi/Lo”, “London Hi/Lo”, “NY Hi/Lo”).
Extends these solid lines to the right as long as they remain untouched by price.
When price first trades through a level, the solid line is cut at that bar and replaced by a dashed line that extends only until the next session of the same type begins.
Older sessions are automatically removed according to the “Max Sessions to Display” setting to reduce chart clutter.
In addition, the indicator plots:
Previous Day High (PDH) & Previous Day Low (PDL)
Previous Day Point of Control (PDPoC) – an approximate volume-weighted price computed from intraday data using a simple binning approach on a user-chosen lower timeframe.
Like the session levels, PDH/PDL/PDPoC start as solid lines. After the first touch, each level switches to a dashed style and continues only until the following trading day, at which point the previous day’s dashed lines are stopped and new levels are created.
Info Table & Multi-Timeframe Logic
An optional on-chart info table summarizes the most recent Opening Range:
OR high, low, and midline
Current OR range in points
Active mode (9:30 Bias vs. Entry Direction)
Current bias or entry-direction status
Whether a signal is “Waiting”, “Armed”, or “Triggered”
Whether the OR was built from the chart timeframe or from a 15-minute higher-timeframe feed
If your chart timeframe is higher than the OR calculation timeframe, the script automatically uses multi-timeframe data to build a consistent OR, while enforcing a maximum chart timeframe of 1-hour for reliability.
How to Use This Tool
Use the OR box and bias to define your primary intraday context around the cash open.
Use session highs/lows and PDH/PDL/PDPoC as objective reference levels for where price may react or where stops and liquidity might cluster.
Treat the signal markers and TP/SL boxes as visual guides only. They can help you structure trade ideas, but they are not a trading system by themselves.
Always confirm levels and signals with your own analysis, risk management, and execution rules.
Limitations & Notes
The script is intended for intraday charts up to 1-hour. By the nature of the information being displayed, any time frame above that may result is undesirable visual clutter.
The POC calculation is an approximation based on lower timeframe bar-level volume and binning; it is not a tick-by-tick volume profile.
Signals and levels update in real time on the current forming bar. Once a bar closes, completed historical signals do not repaint, but the last live bar can change until it closes.
The indicator does not use lookahead or offset plotting into the past; it is not designed to predict the future or guarantee any particular trading result.
Always test settings on a demo environment first and manage risk according to your own plan.
